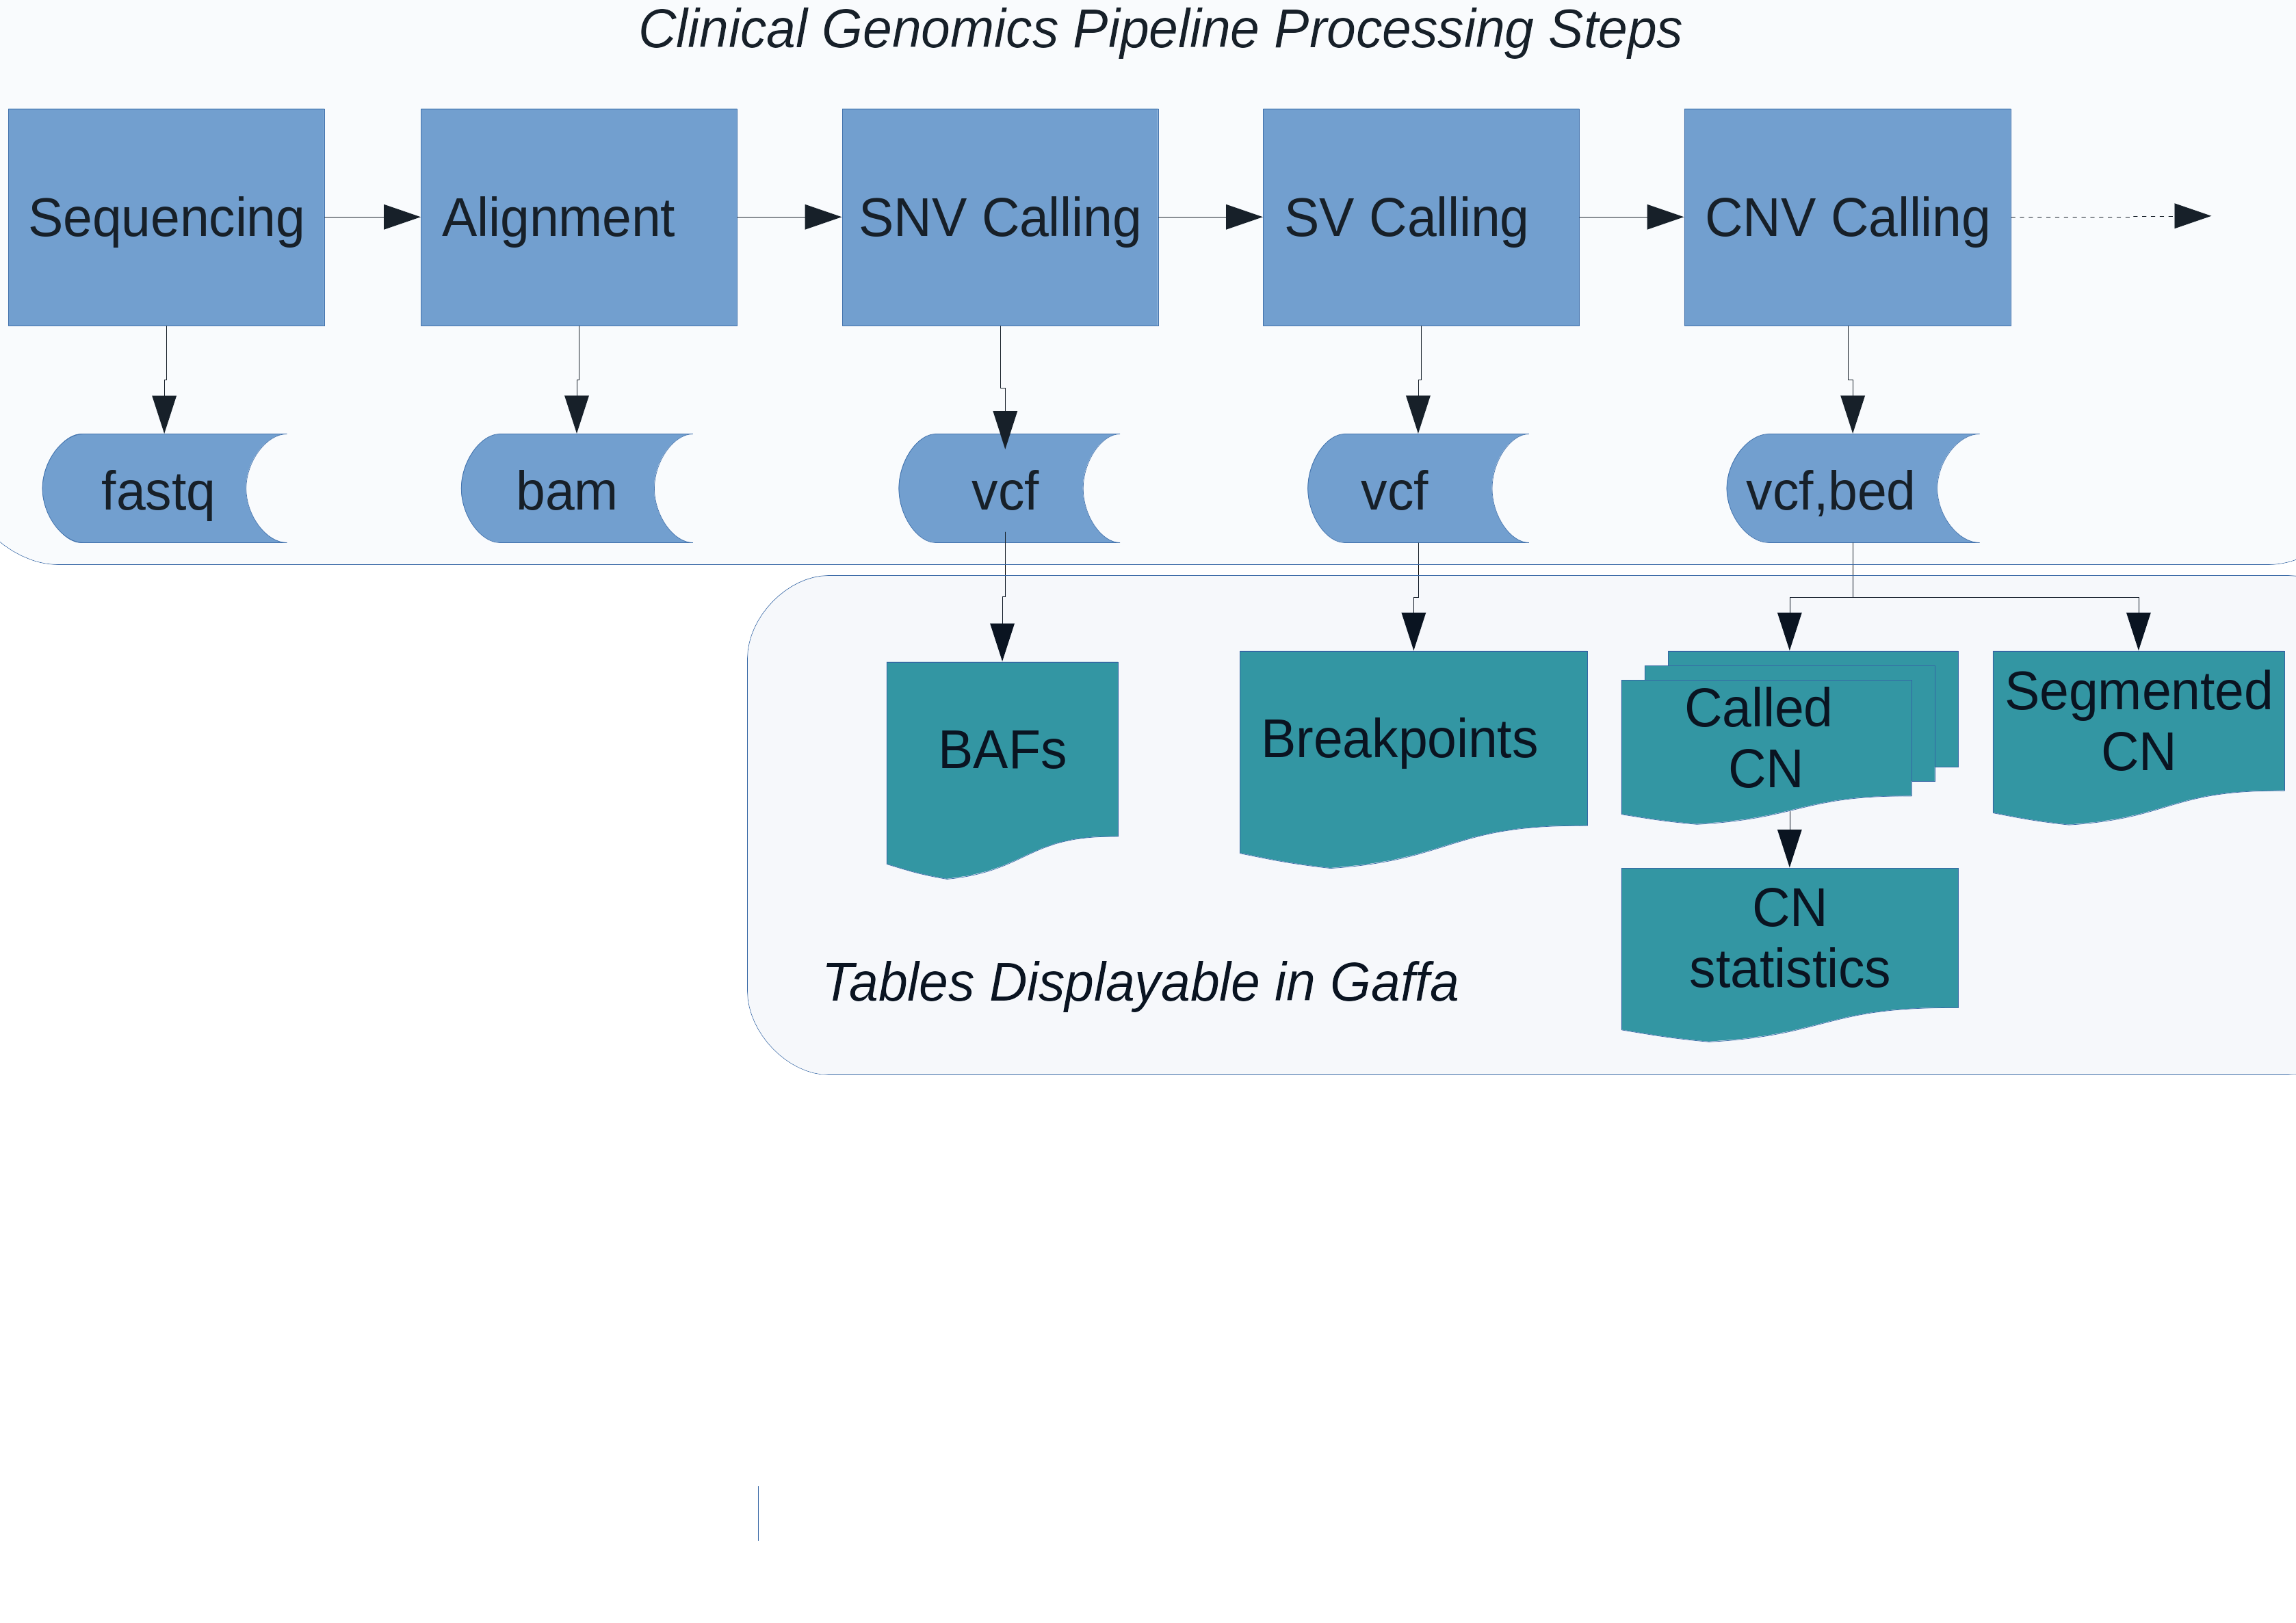
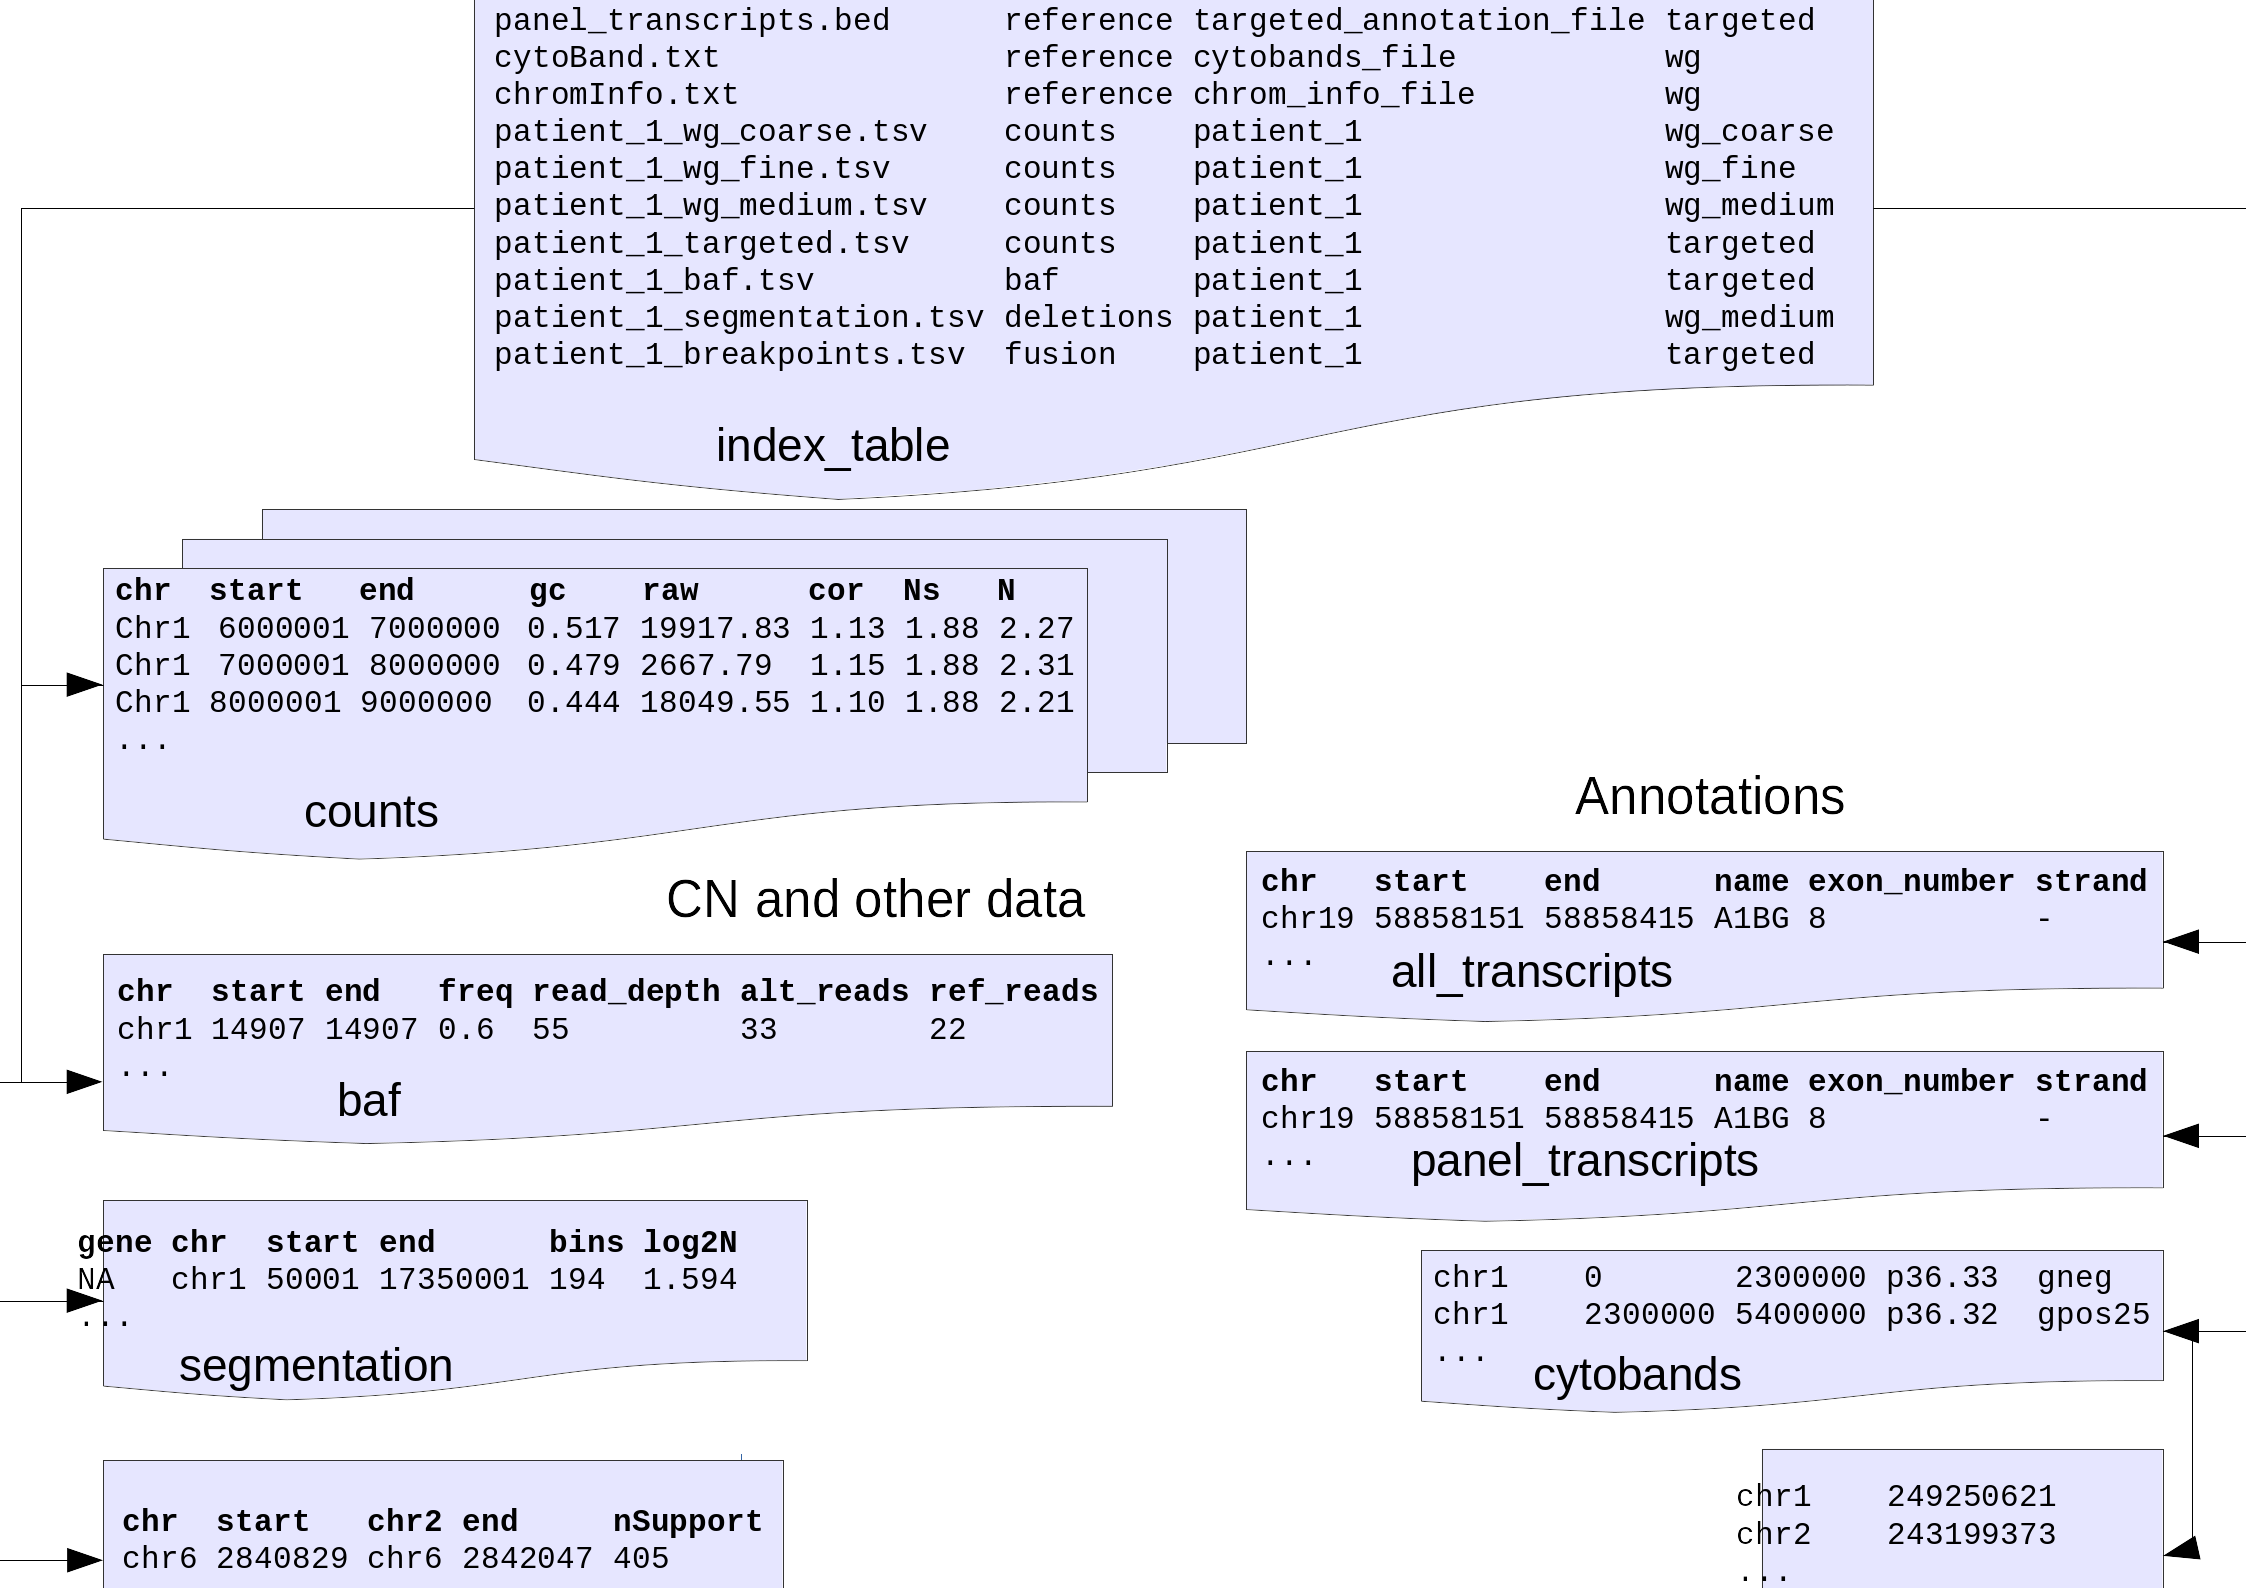
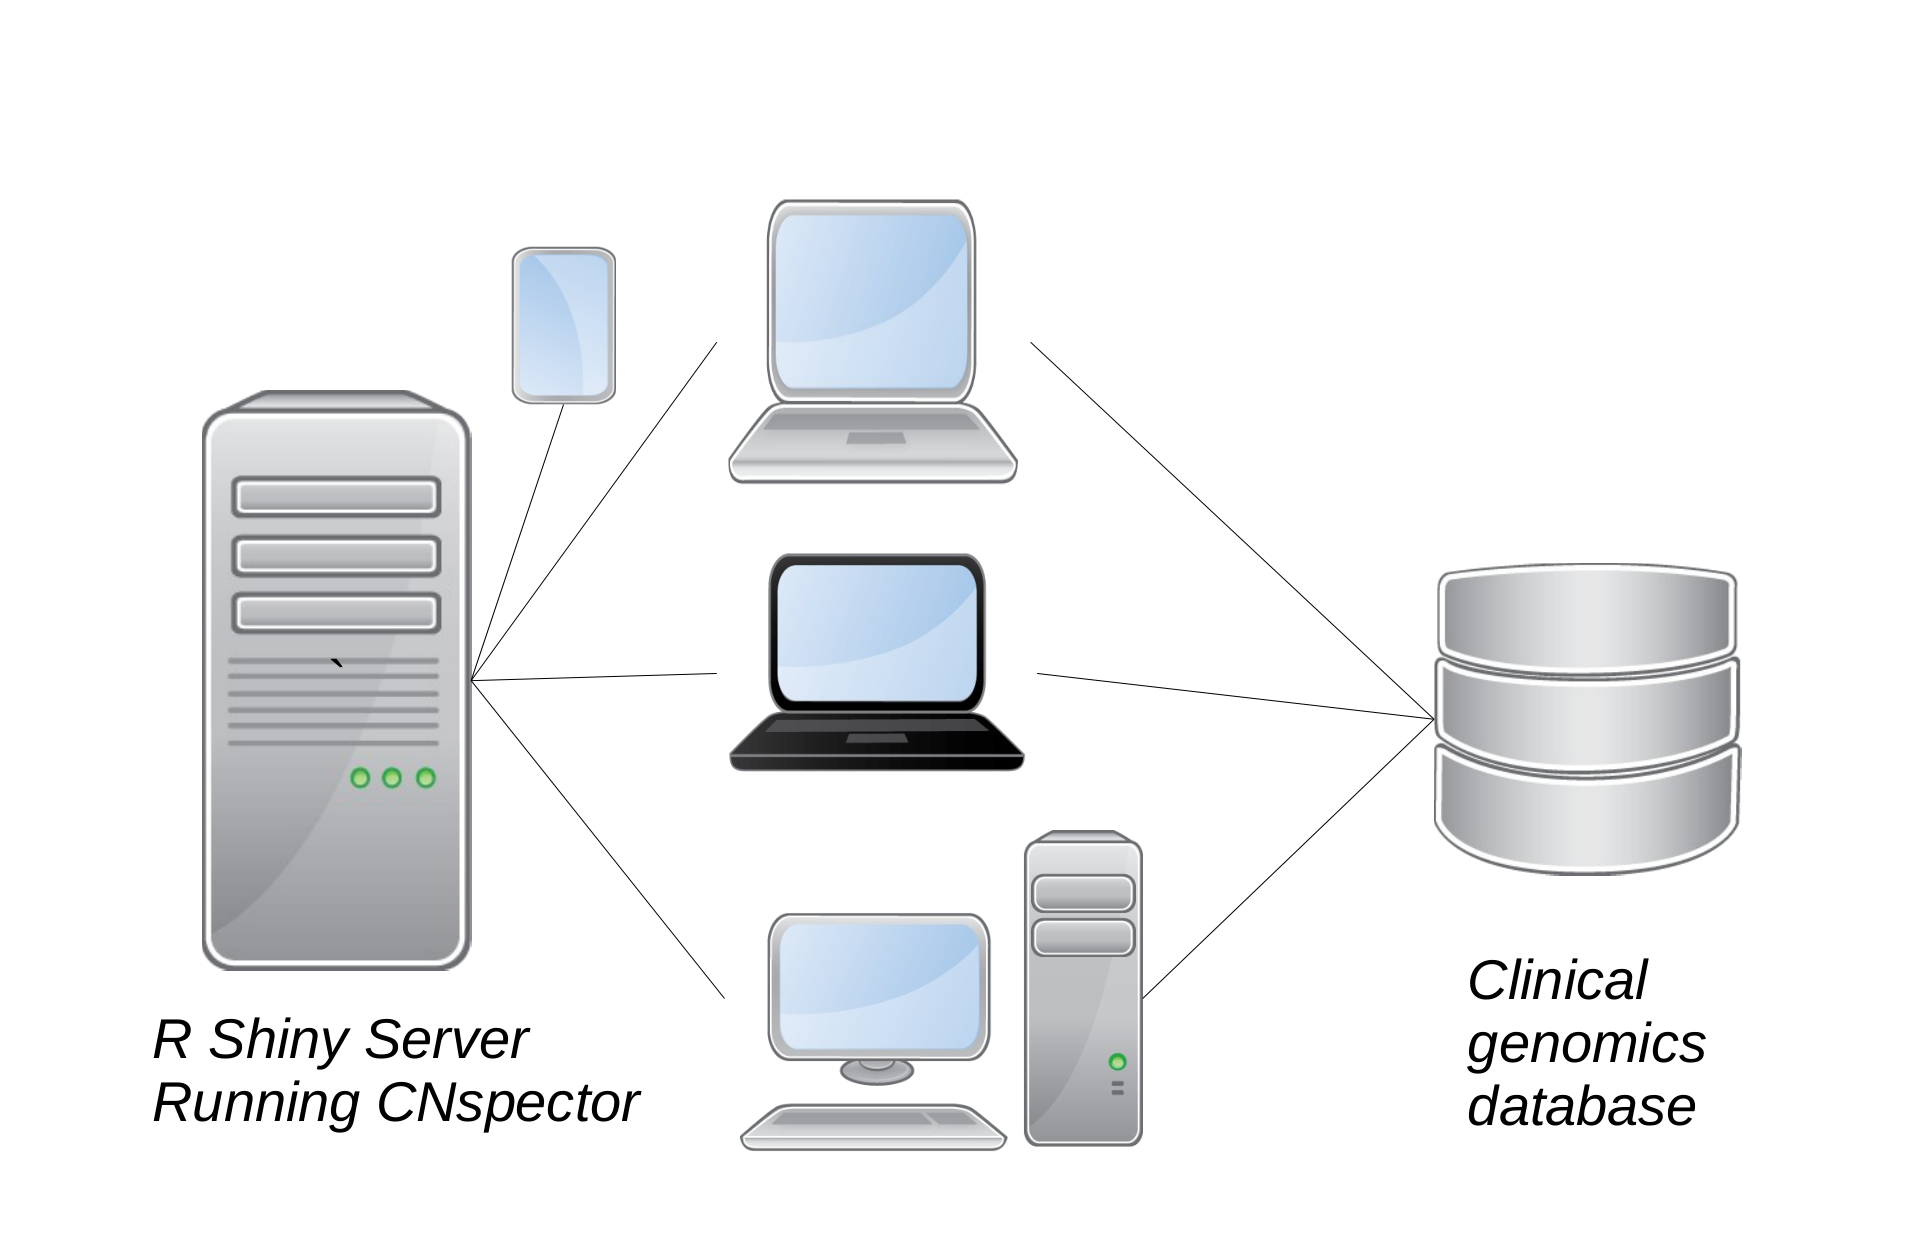
Figure 1(c) Integration of CNspector with existing clinical work flows. (a) Stages of processing for a clinical genomics pipeline (b) Pre-built tables at all viewable scales allow rapid rendering in CNspector (c) CNspector is implemented with a client-server architecture allowing it to be used on any device with a web browser. Integration with an existing clinical genomics system can be done by linking to a URL identifying the sample and loci to be viewed.
Figure 2 (a)-(c)
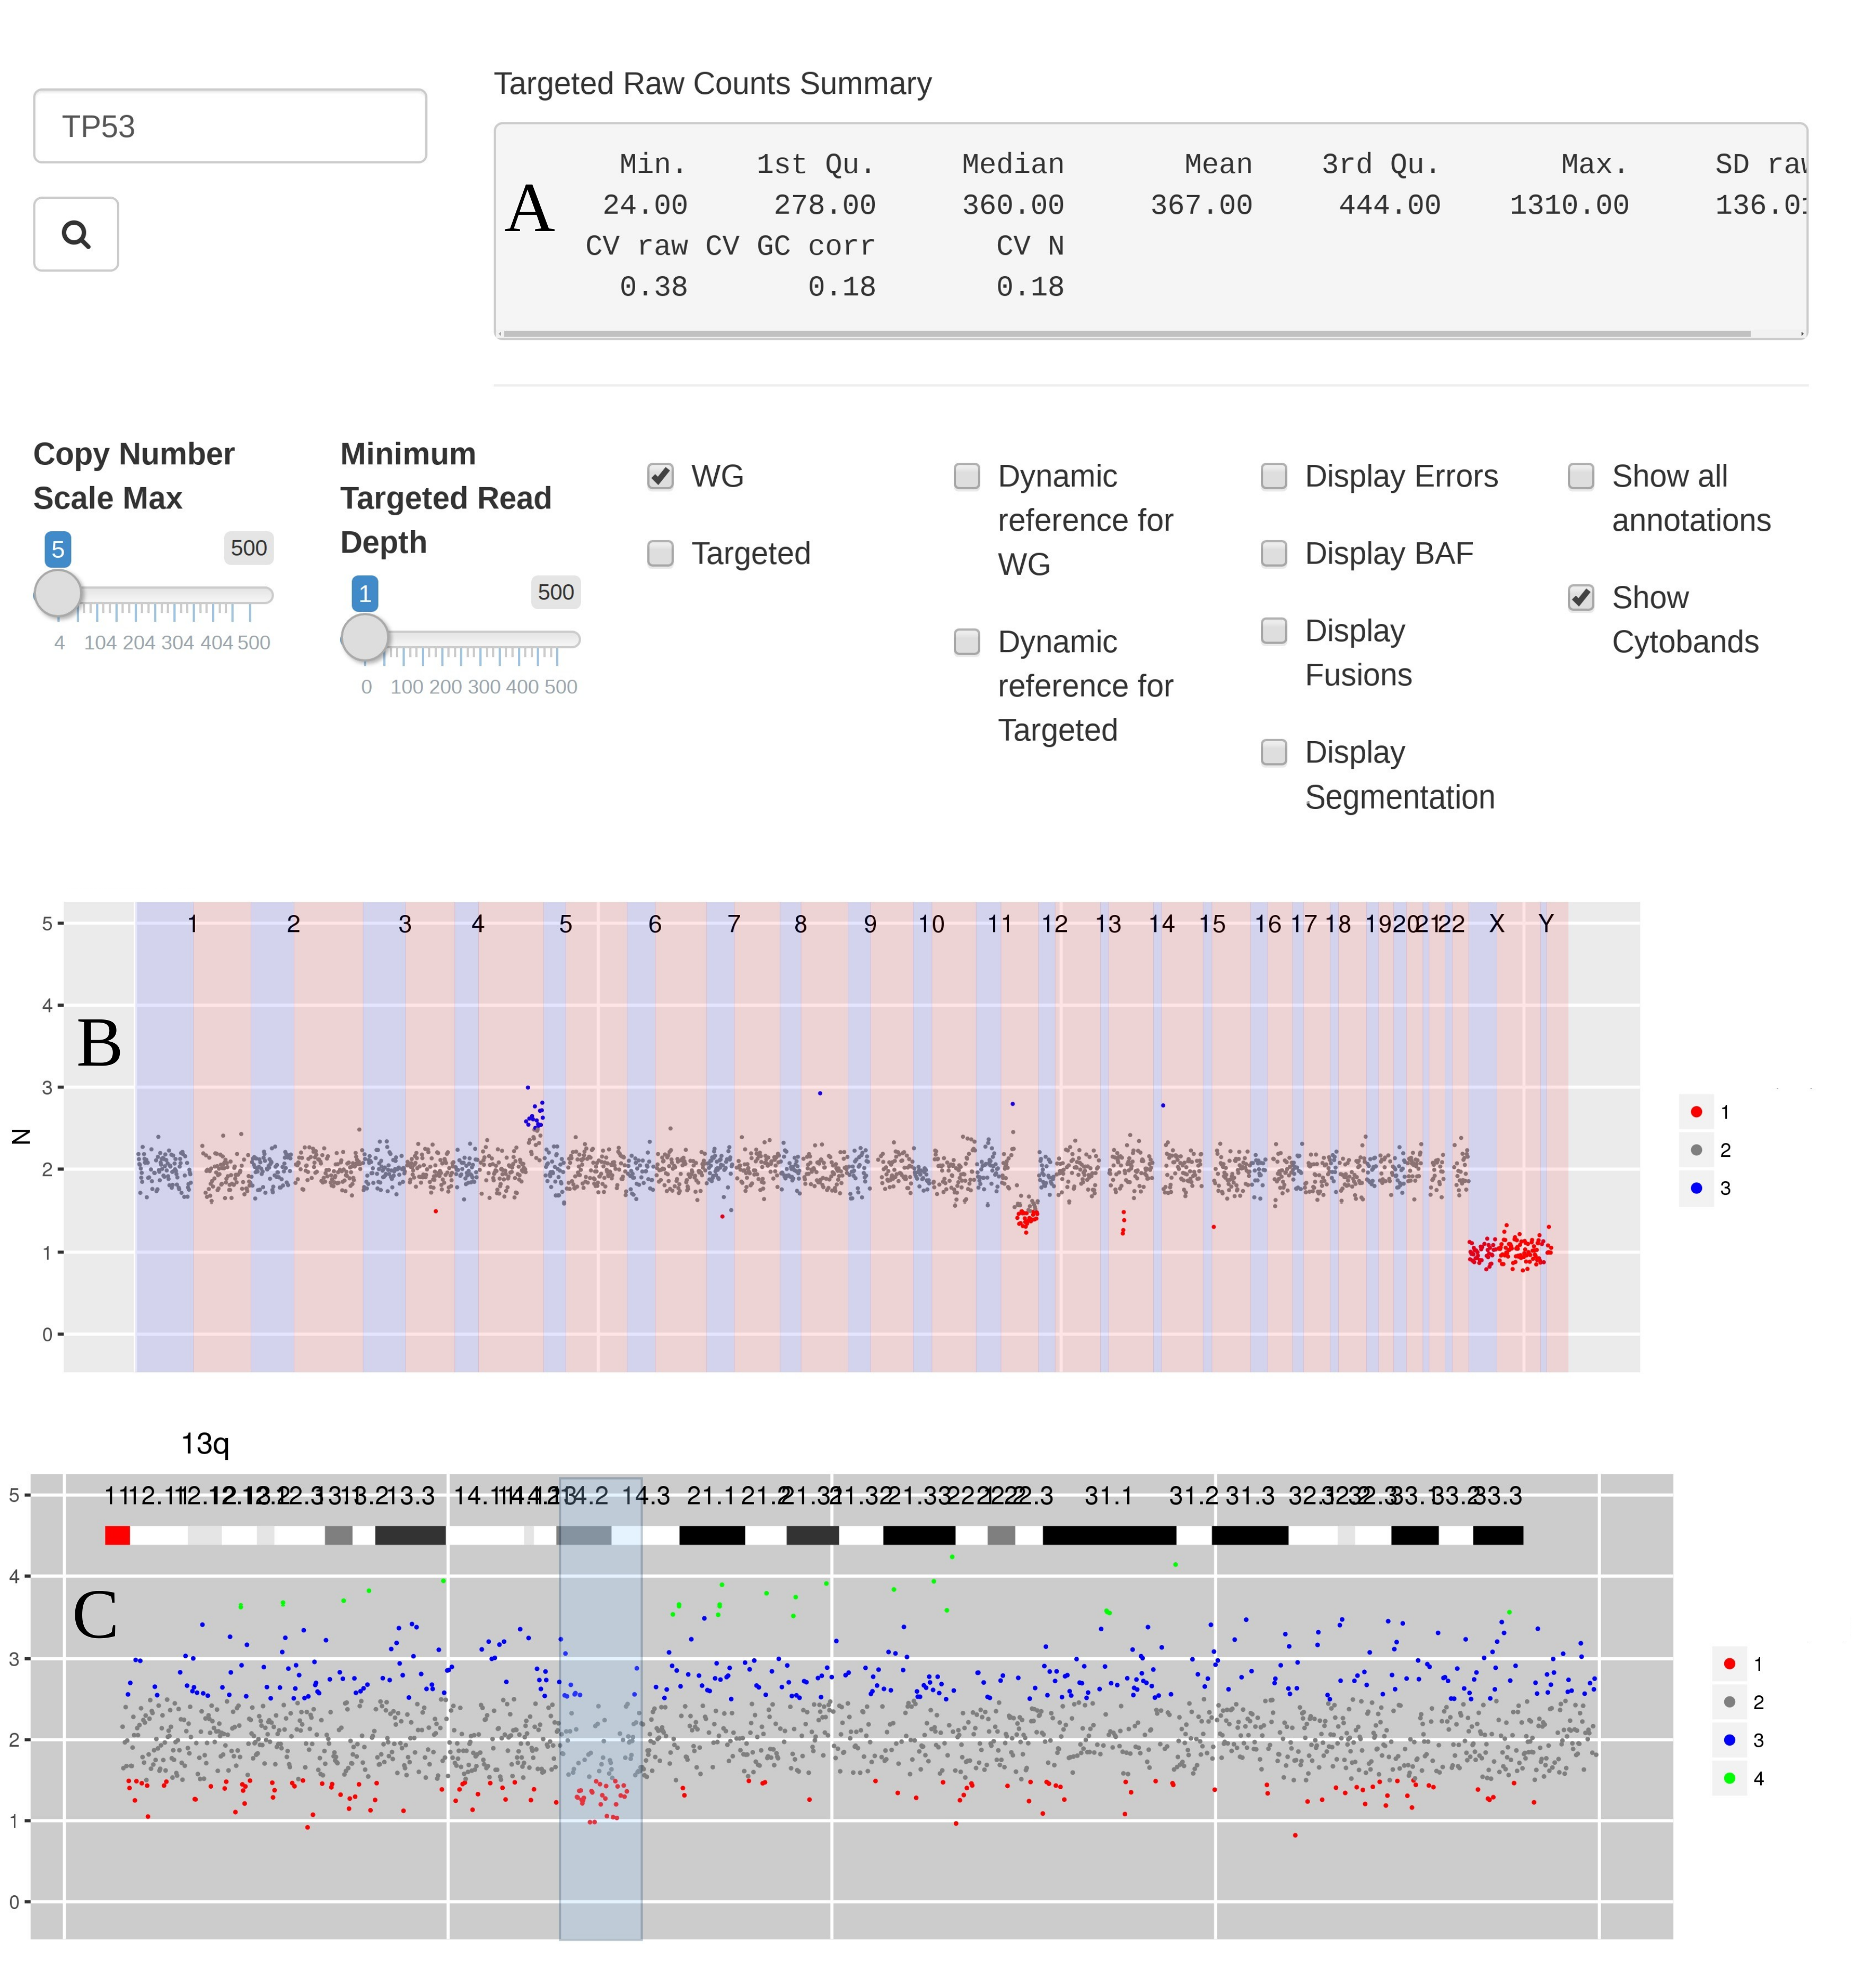
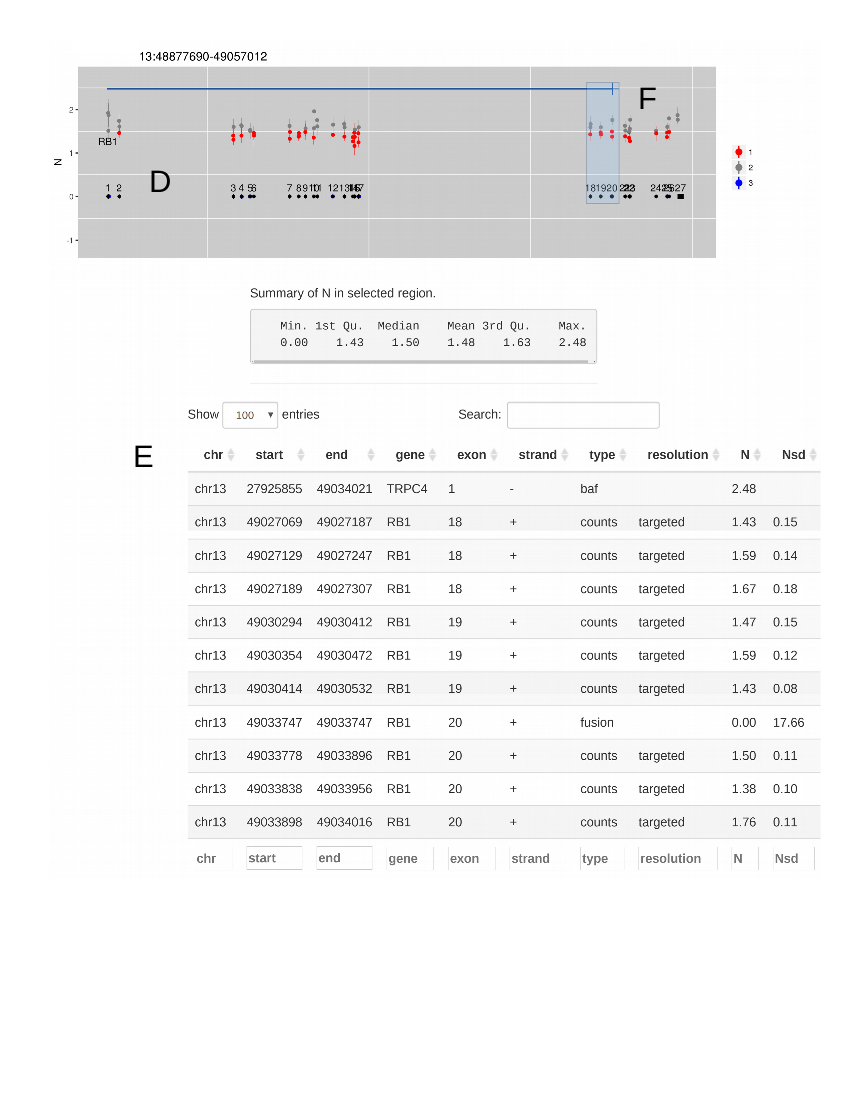
Figure 2 Steps when using CNspector to assess CNVs (a) An initial QC step consists of checking coverage and sample noise for raw read counts and estimated copy number (b) CN changes at the chromosome and chromosome arm level are checked in the top plot, made of 1MB bins. (c) Smaller scale gains and losses such as the one on 13q can be checked on the second plot. (d) Selecting regions of interest in the second plot enables assessment of CN with respect to exon-level annotations in the third plot. (e) Selecting points of interest in this plot displays relevant details such as copy number estimate at each bait, error estimate based on reference samples and estimated read abundance. (f) Supporting evidence may also be viewed - in this example one end of a breakpoint near exon 20 of RB1 is shown. Other sorts of supporting evidence would be boundaries of segmented regions and B-allele frequencies.
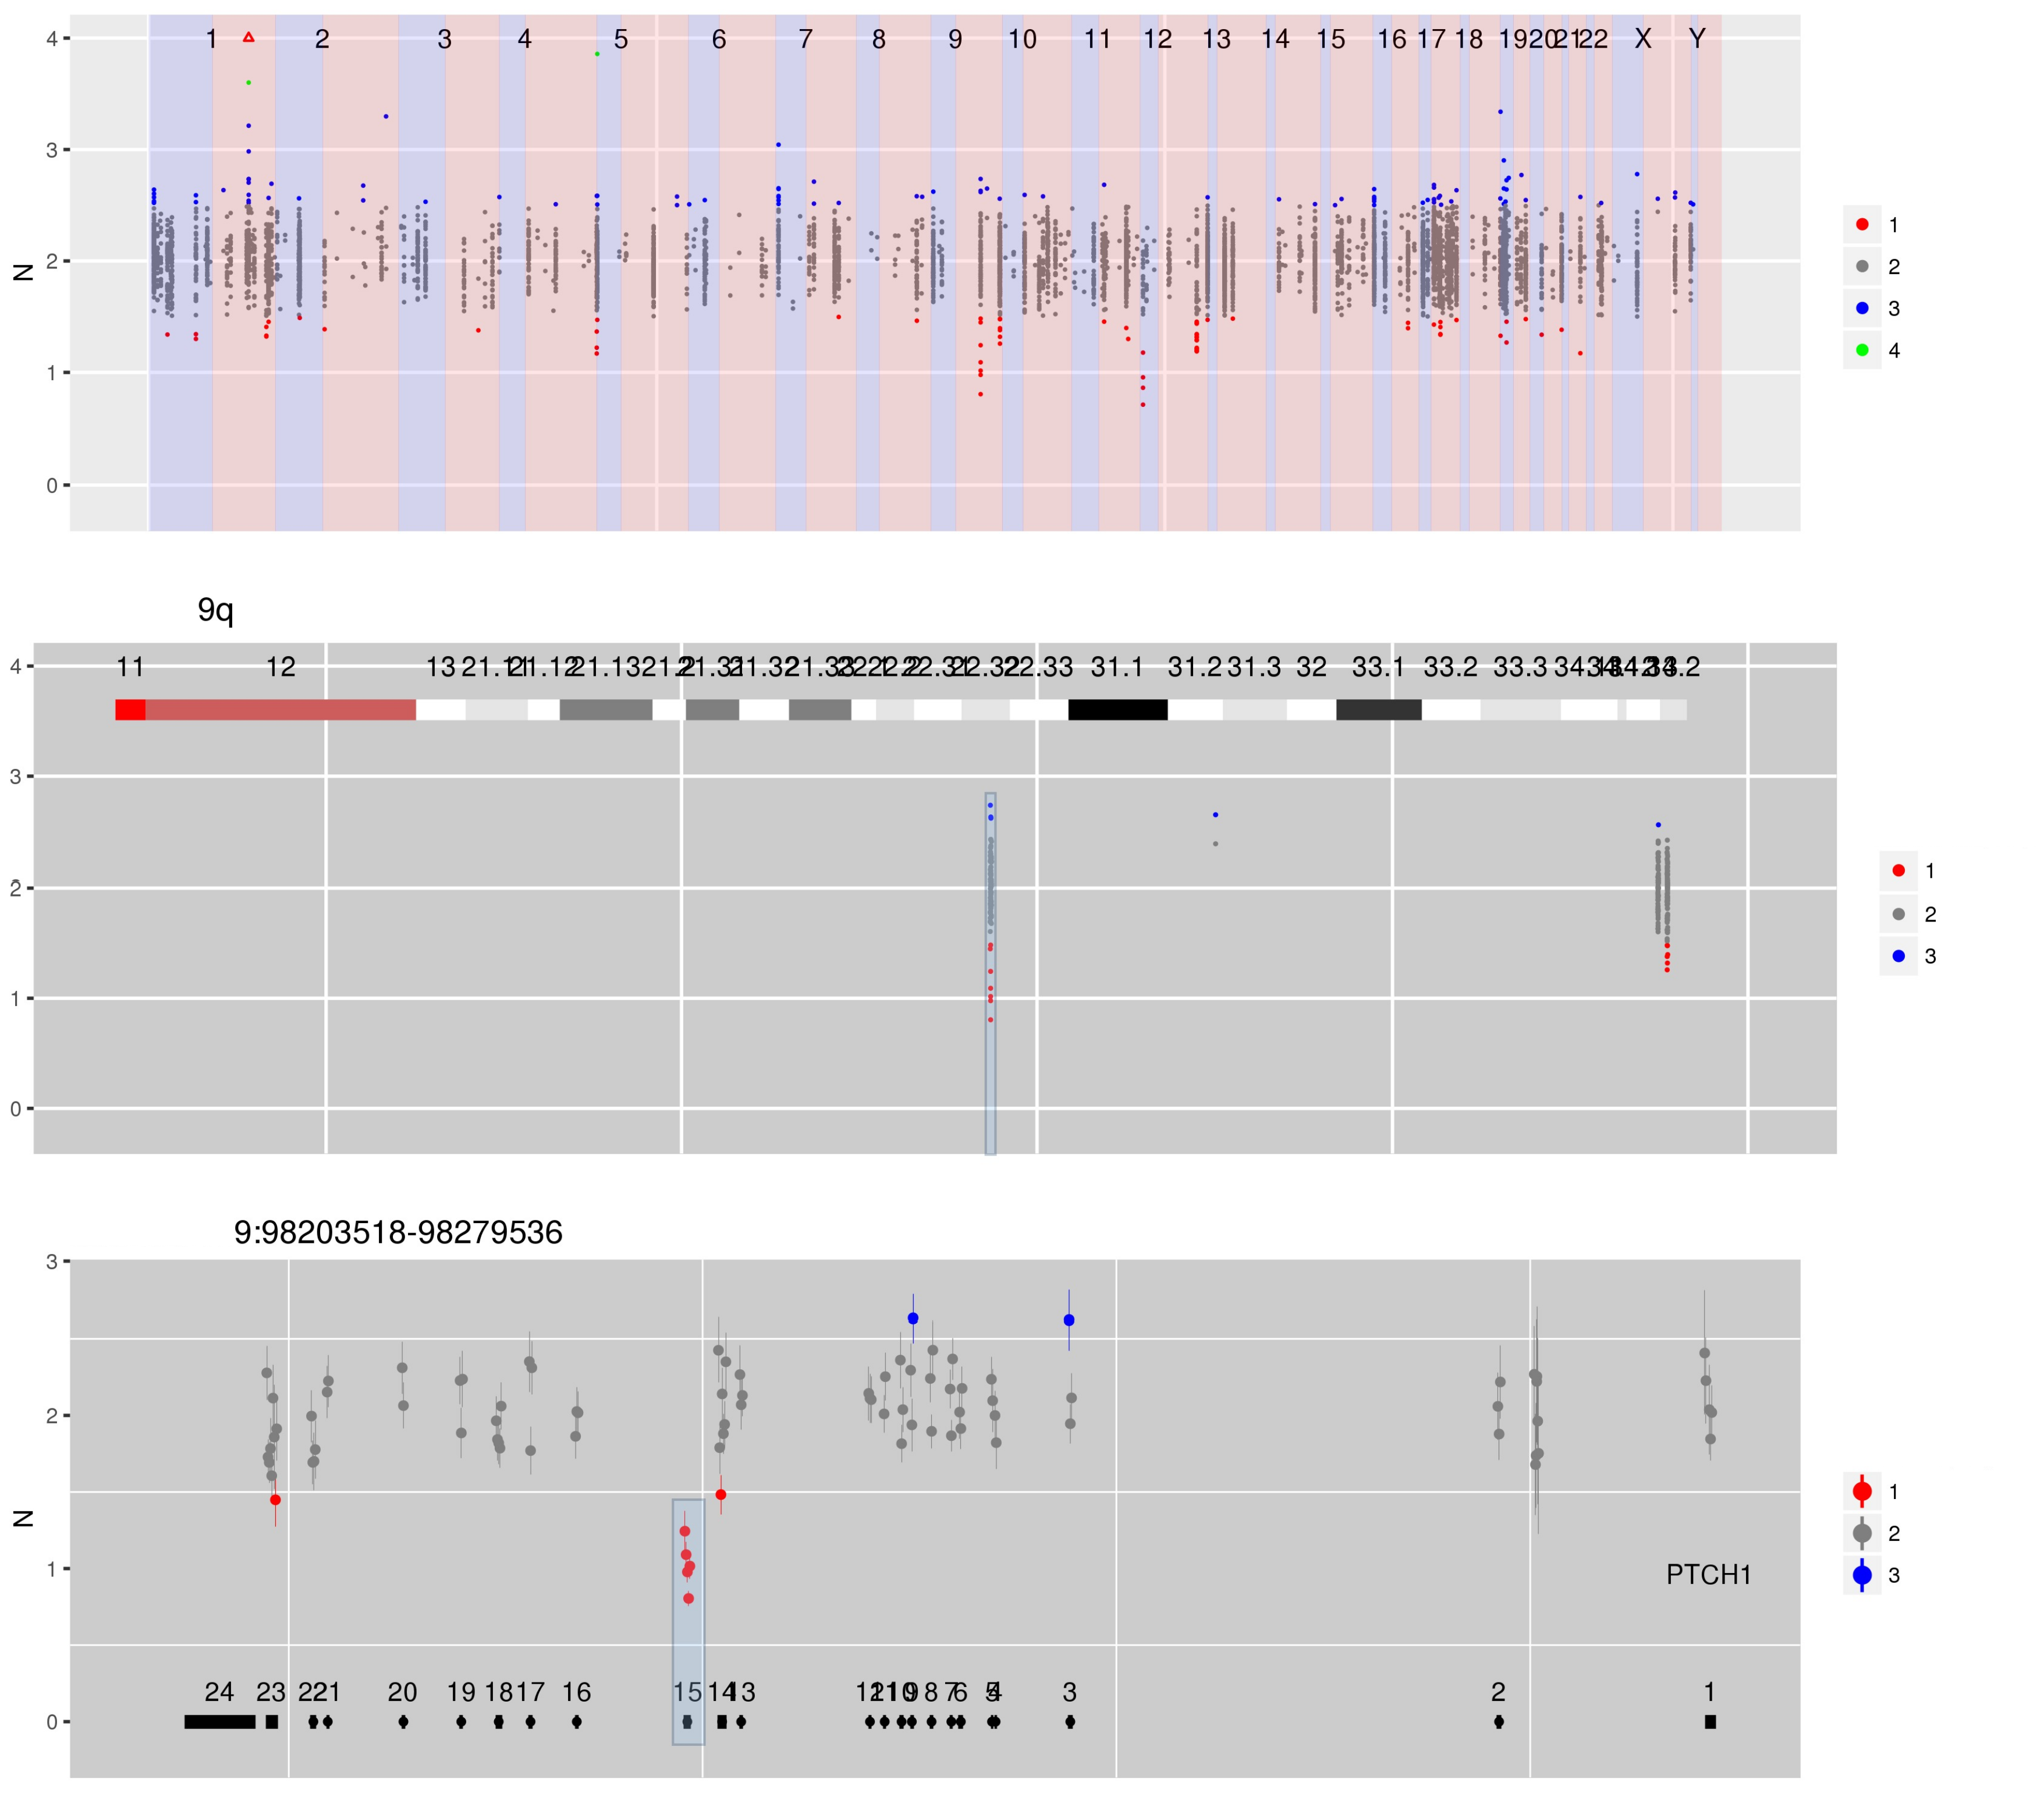
Figure 3 CN estimates for enriched regions - in this case genes in which germline mutations confer an increased risk of cancer - show a focal loss at exon 15 in PTCH1.
Interactive version of Figure 3
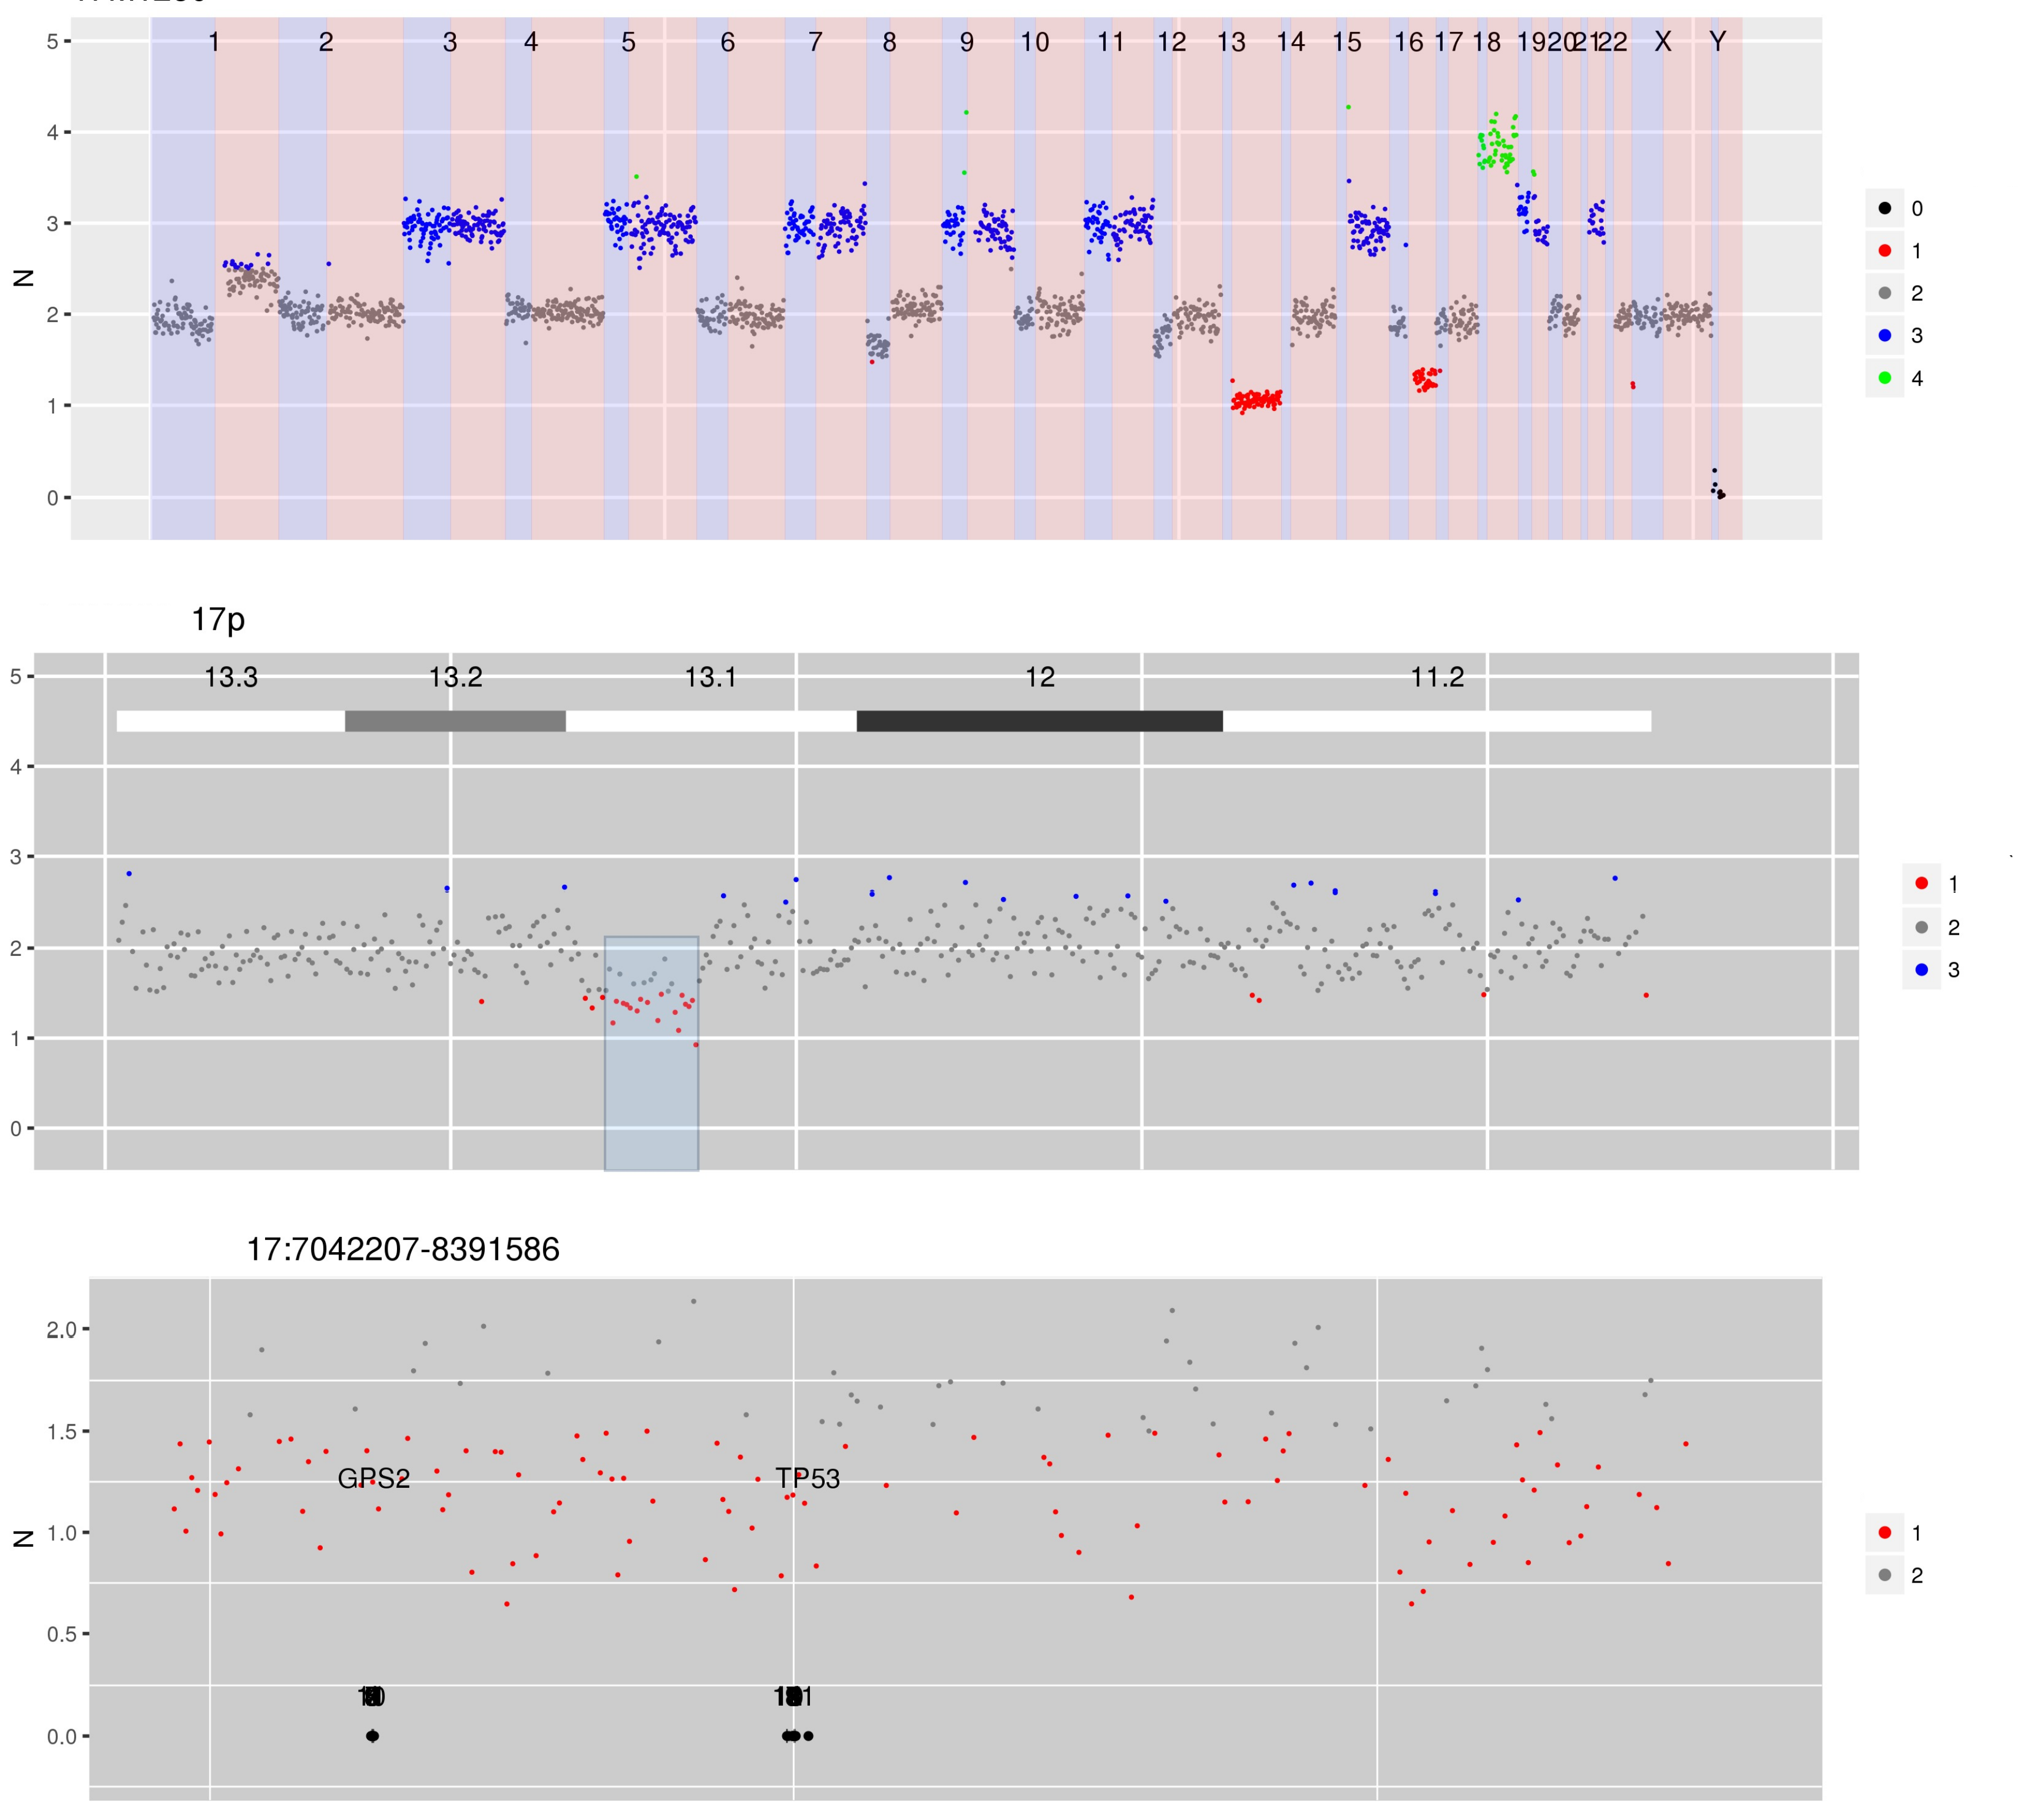
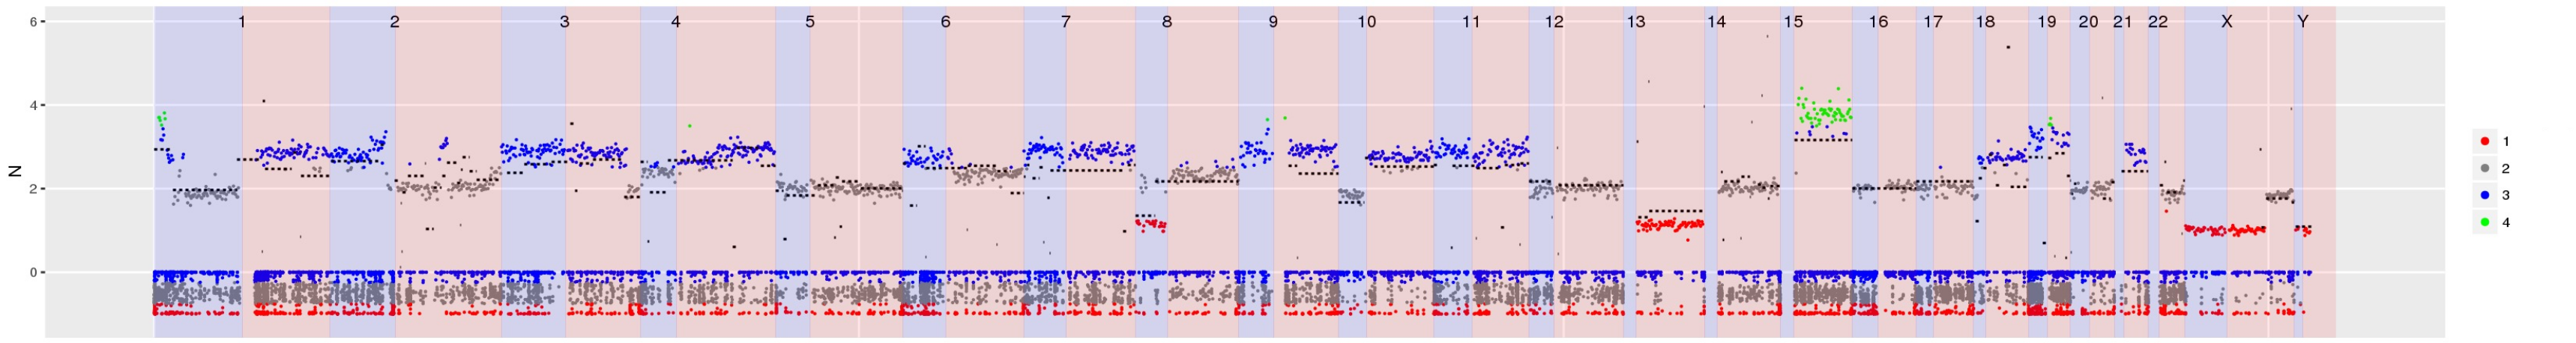
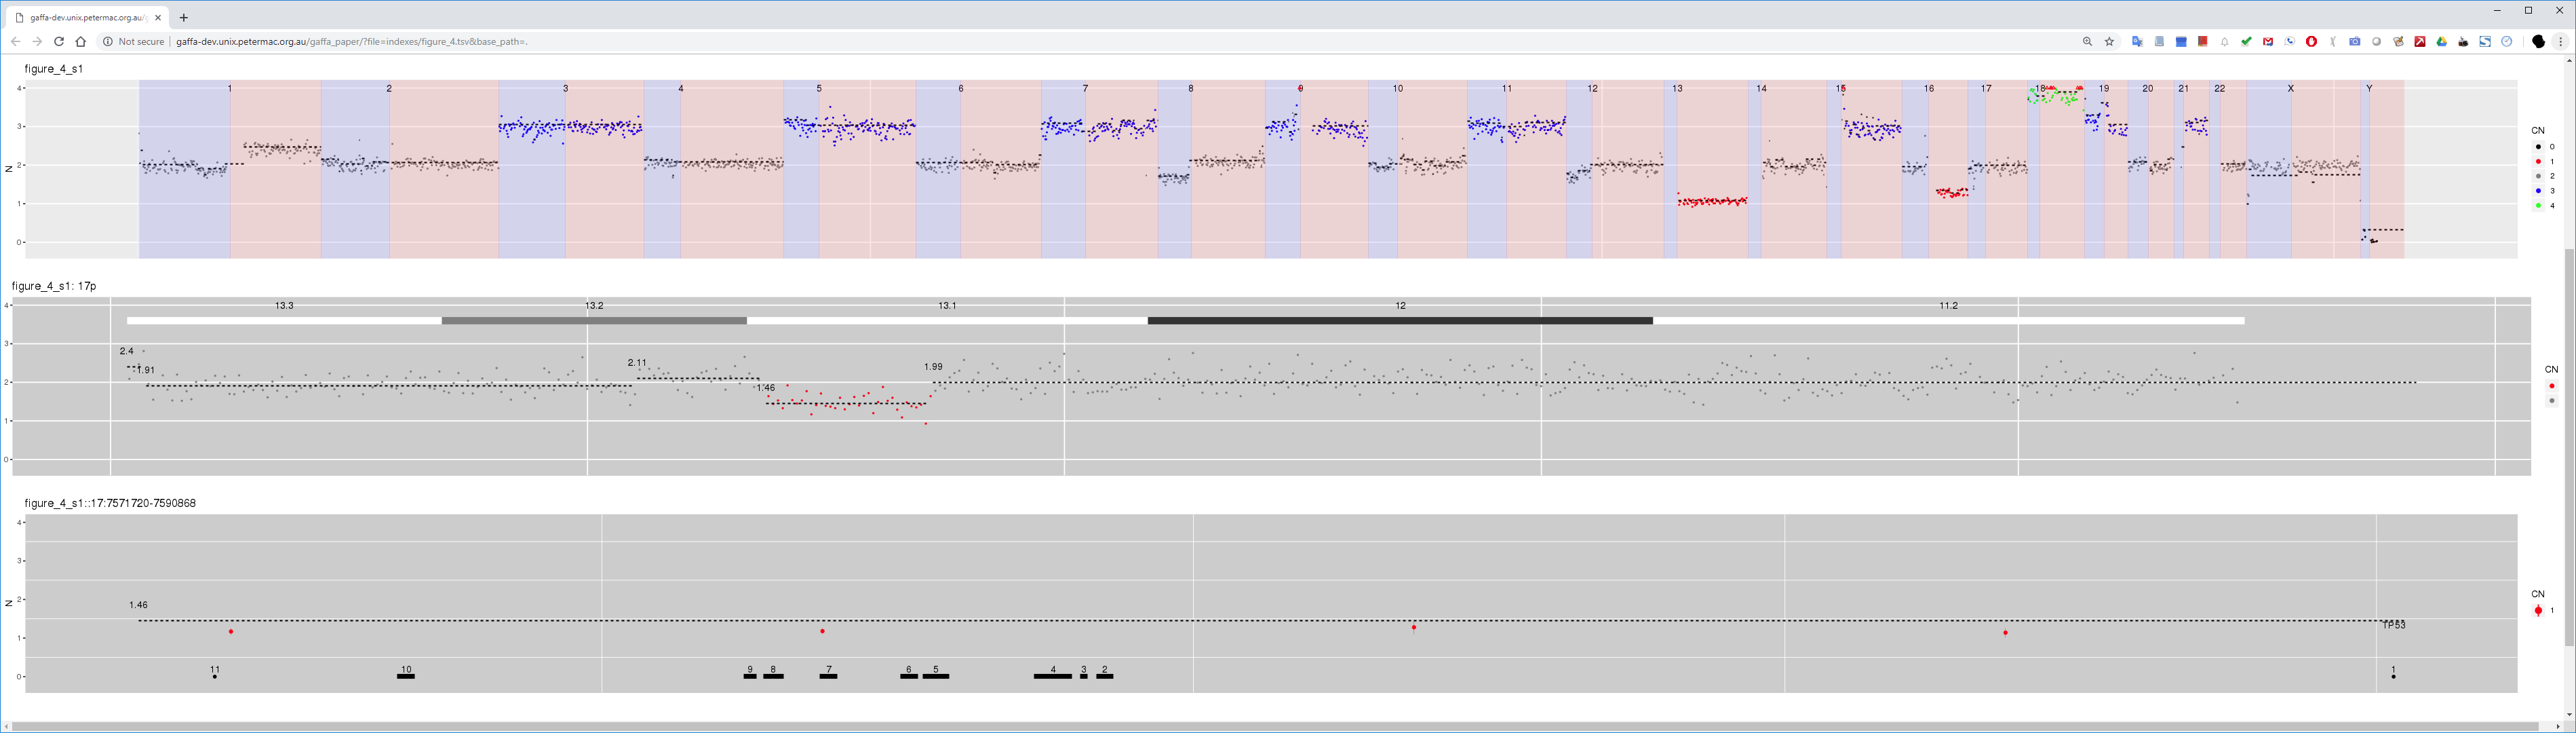
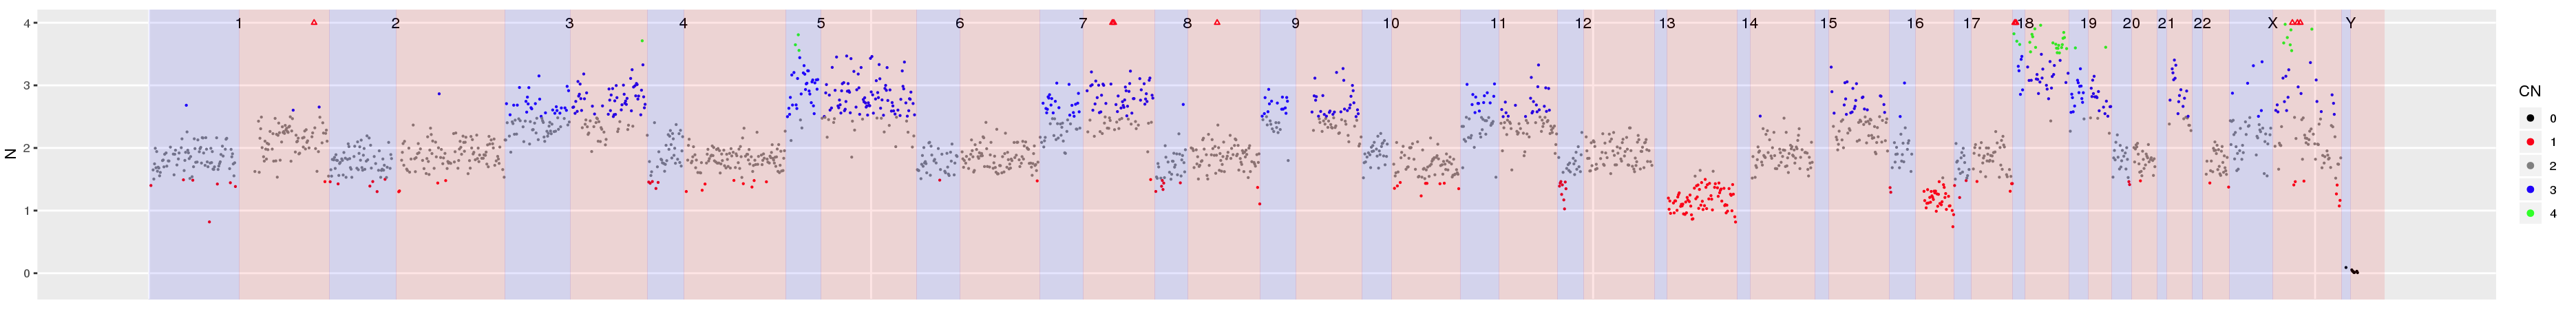
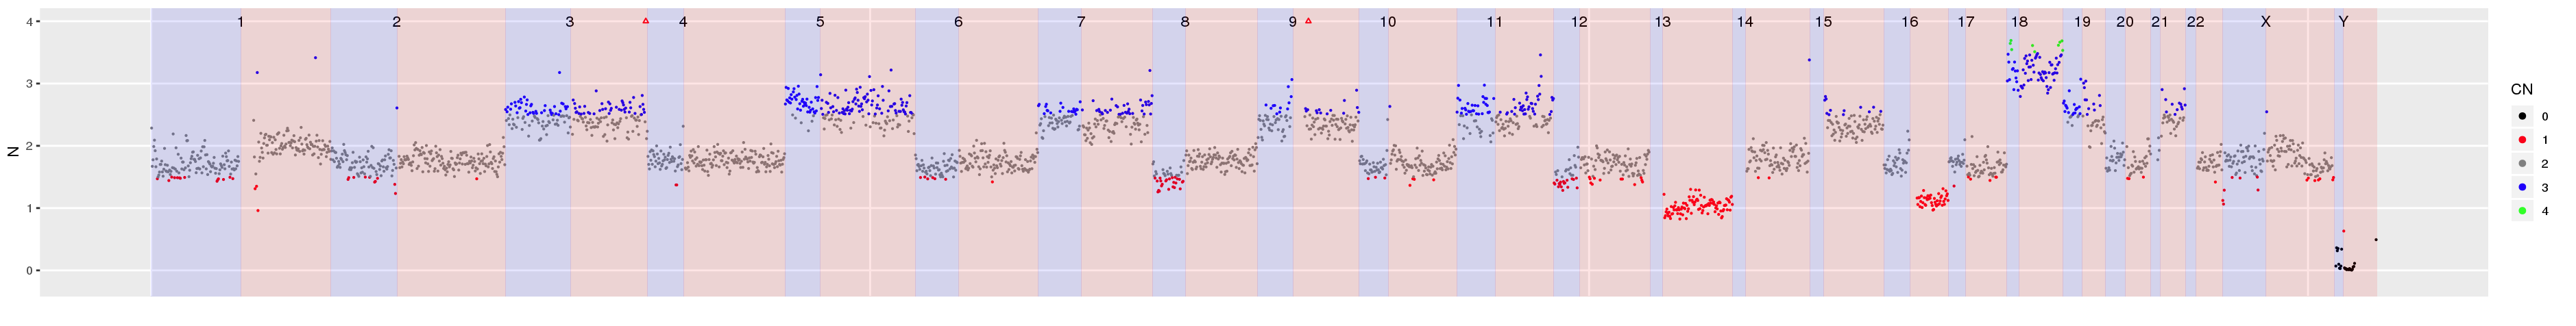
Figure 4 CN estimates for WG derived from targeted sequencing of a myeloma patient. Common chromosome duplications can be seen on odd chromosomes along with sub-clonal CNV on 1q, 8p and 16q. A focal deletion involving TP53 is hi-lighted for display in the bottom panel.
Interactive version of Figure 4
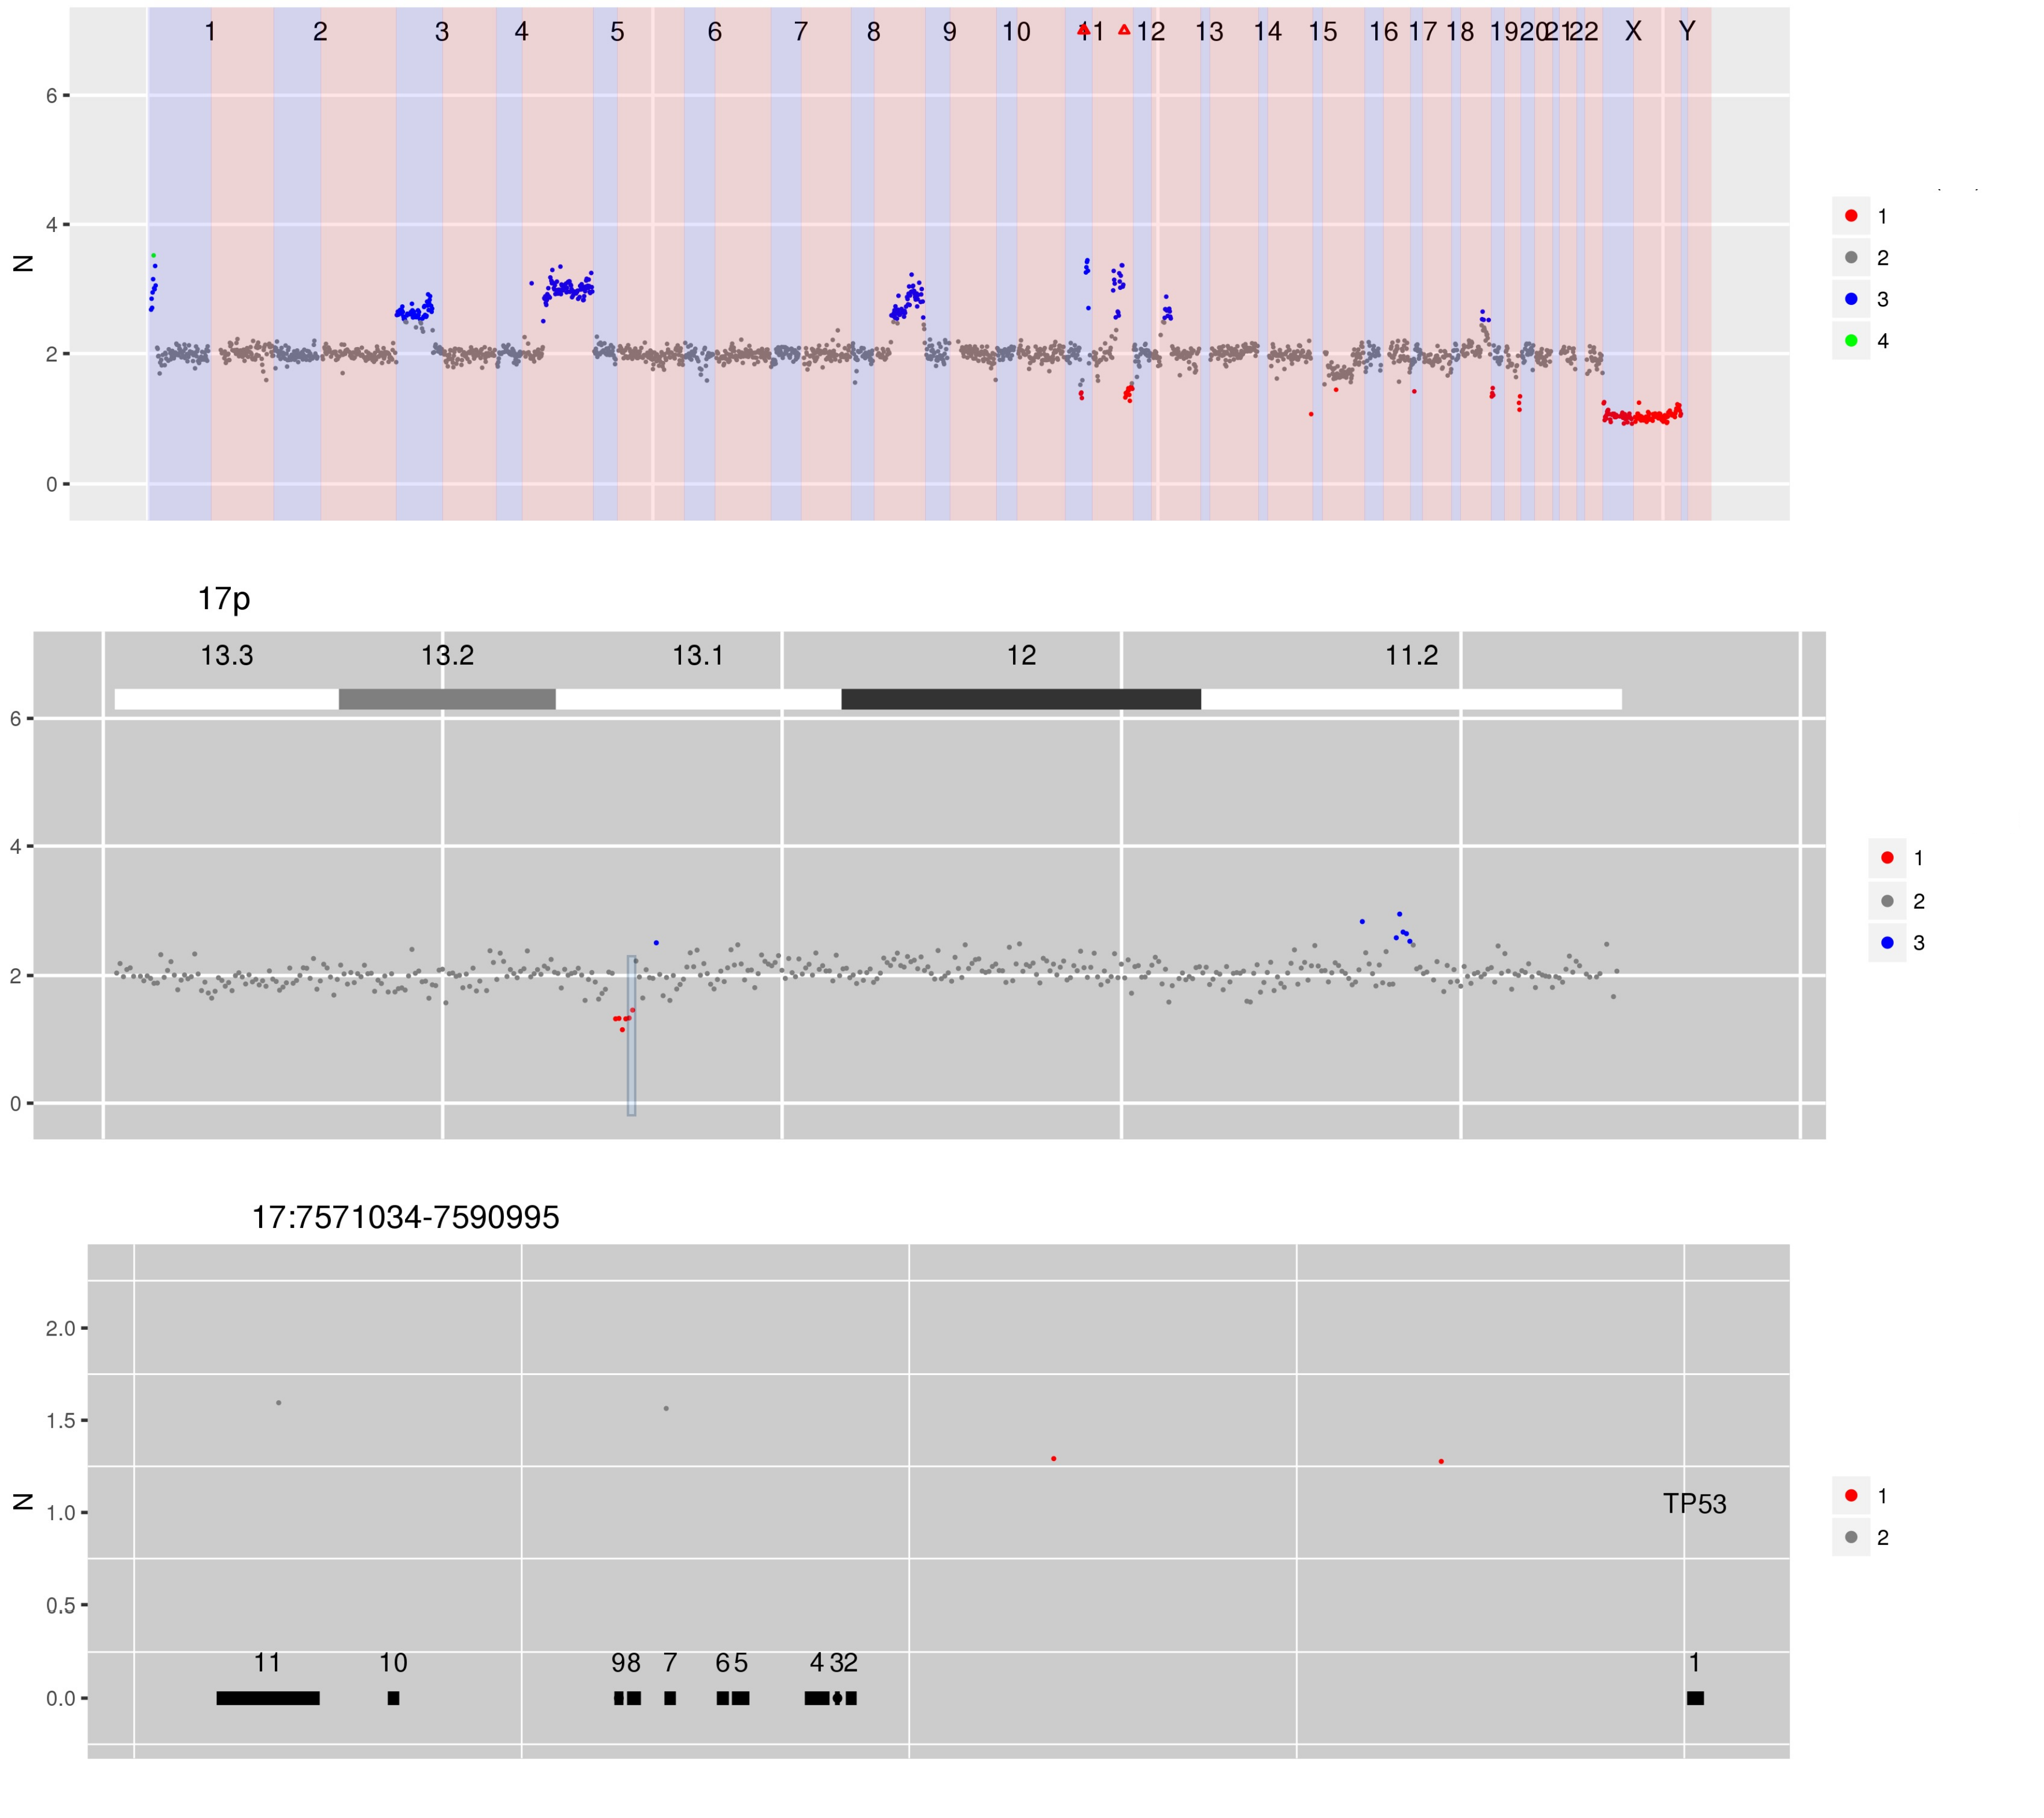
Figure 5 CN estimates for WG derived from targeted sequencing of circulating cell-free DNA from a patient with diffuse large B cell lymphoma. Several focal amplifications and deletions are apparent, including the hi-lighted focal deletion spanning TP53.
Interactive version of Figure 5
SI Figure 1 (a) CN estimates for WG derived from targeted sequencing of a circulating tumour DNA (ctDNA) using a reference made from a batch of normal cellular DNA samples. (b) CN estimates for the same sample using multi-sample mode to construct reference made from other ctDNA samples. The resulting CN estimates are less noisy because the technical artefacts in other ctDNA samples are a better match than the batch of normal samples.
SI Figure 1 (b) CN estimates for the same sample using multi-sample mode to construct reference made from other ctDNA samples. The resulting CN estimates are less noisy because the technical artefacts in other ctDNA samples are a better match than the batch of normal samples.
Interactive version of SI Figure 1
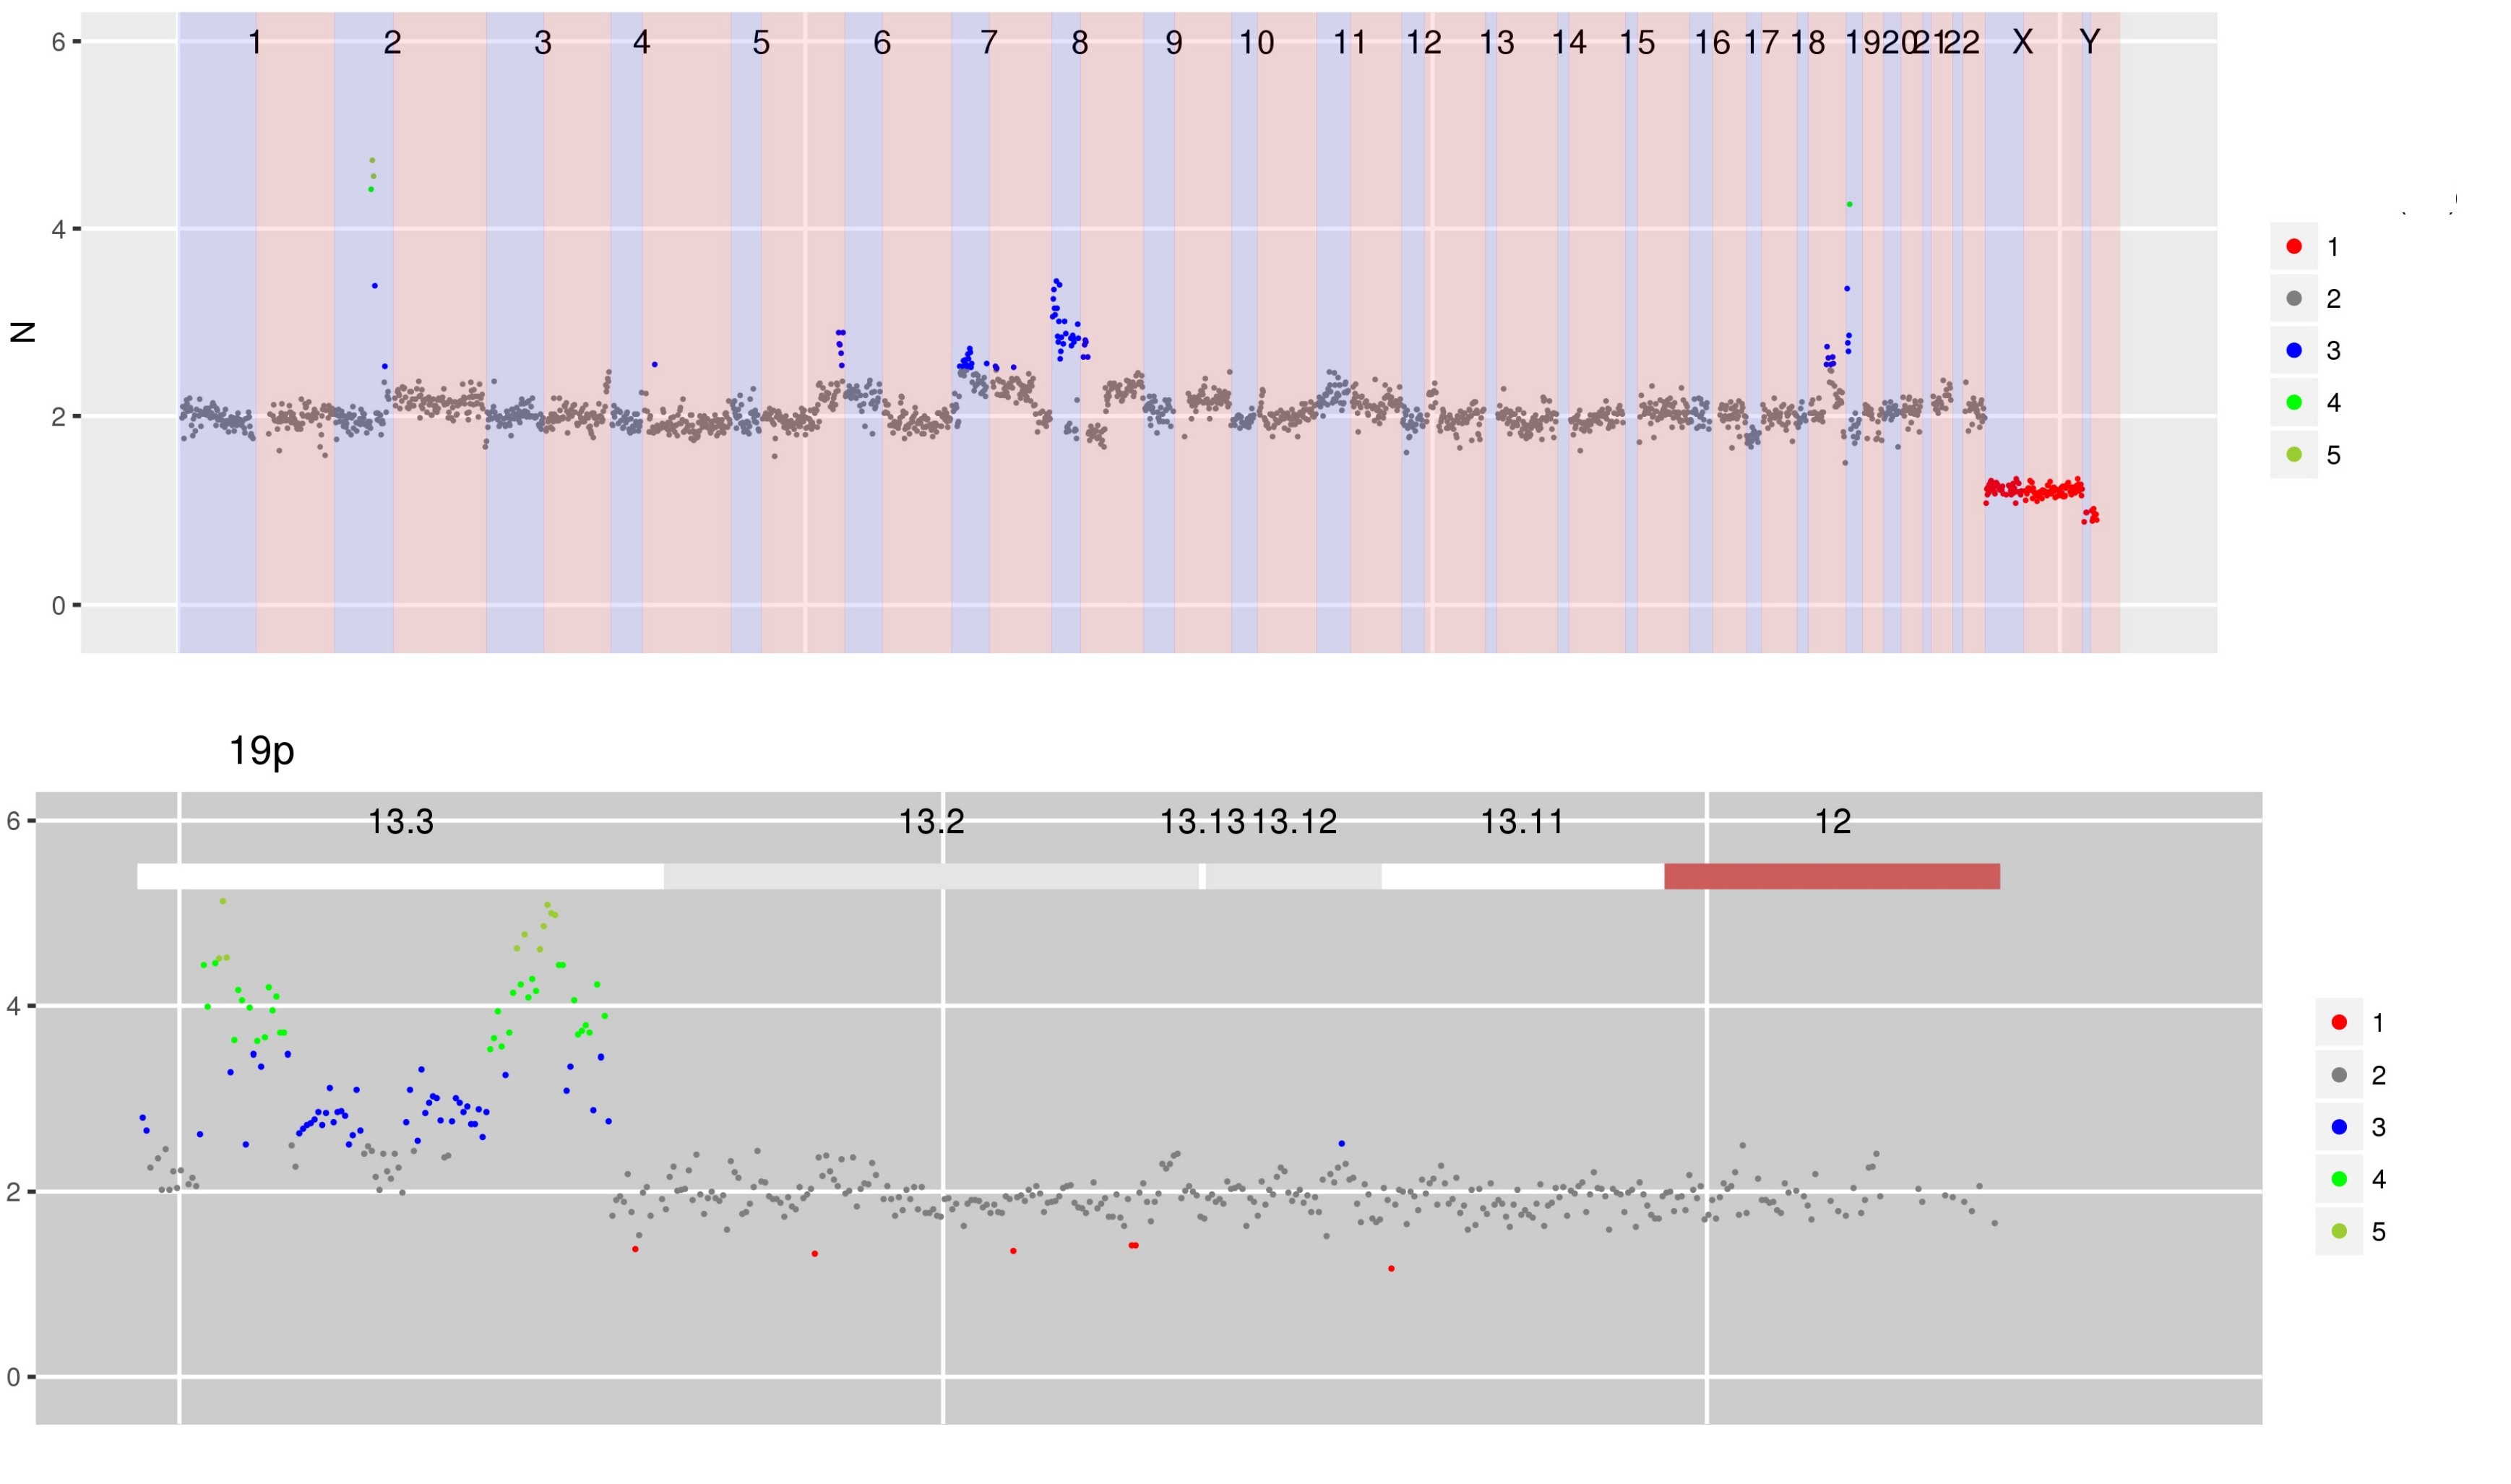
SI Figure 2 (a) CN estimates for WG derived from targeted sequencing of ctDNA containing focal amplifications at chromosomes 2p, 8p and 19p.
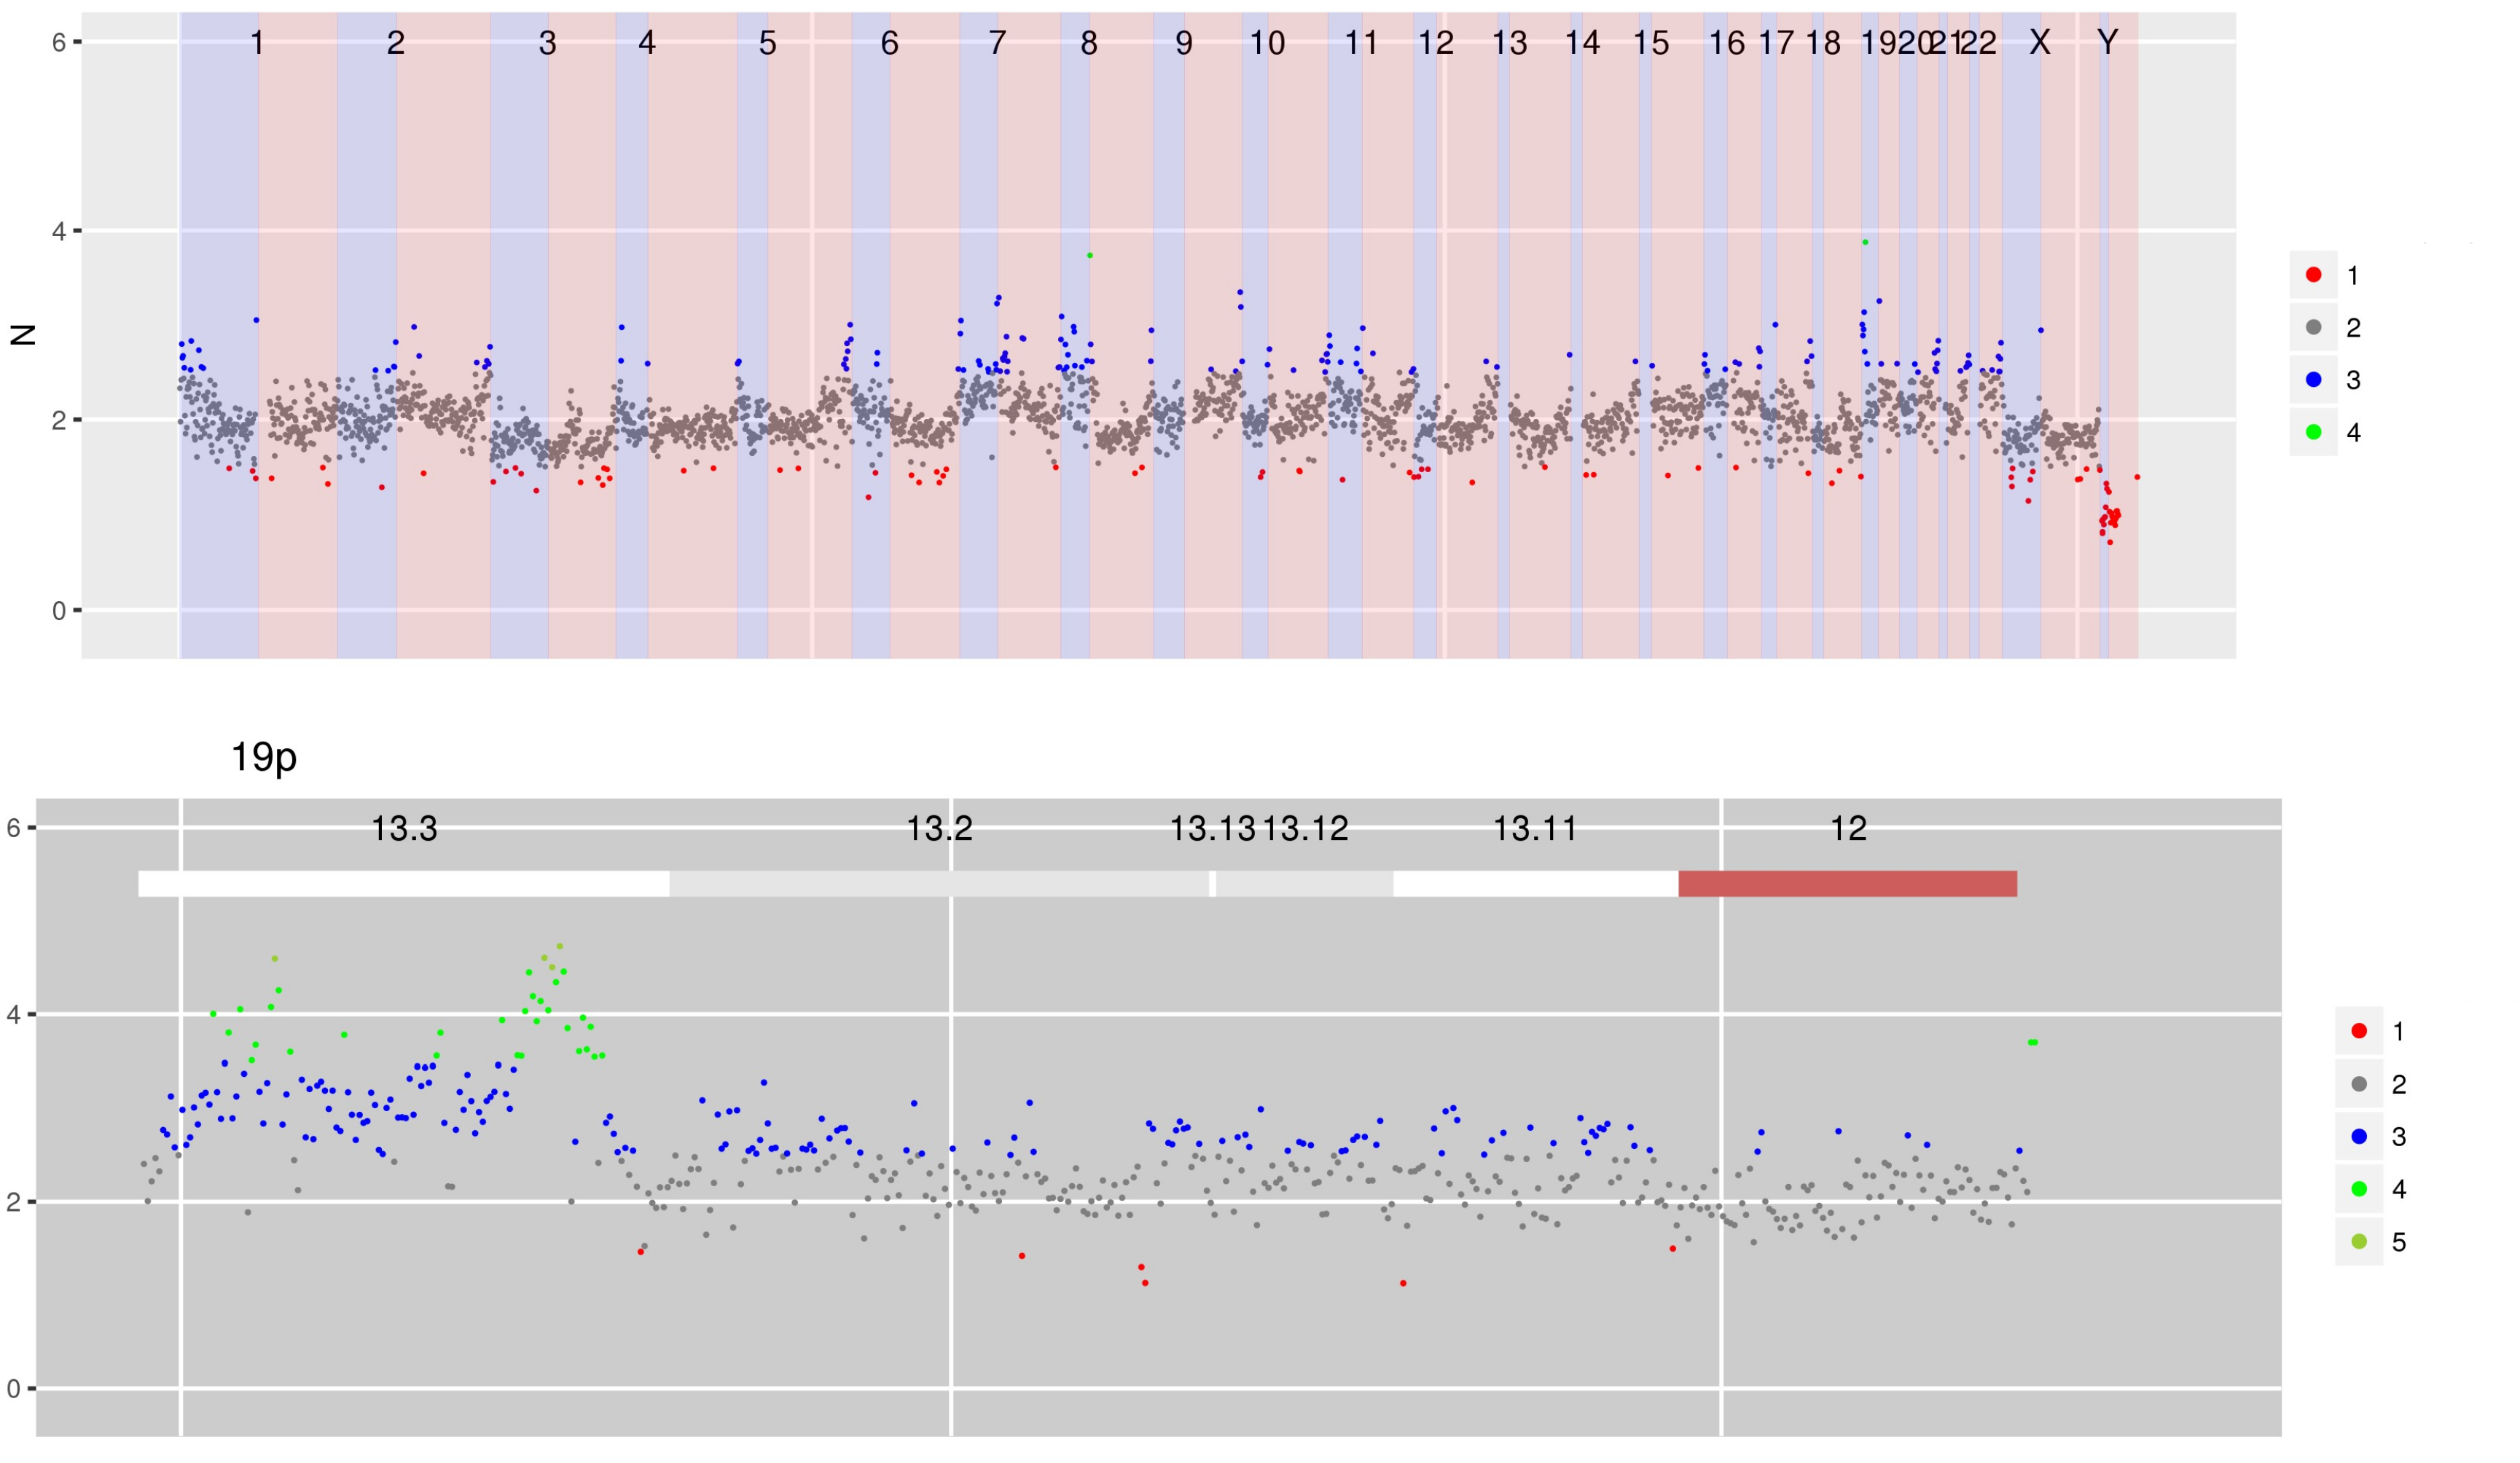
SI Figure 2 (b) Using multi-sample mode to display this sample scaled by a previous sample obtained from an FFPE block shows that the amplifications in chromosomes 2p and 8p are shared but that amplification in chromosome 19p is only in the second sample.
Interactive version of SI Figure 2
SI Figure 3 (a)
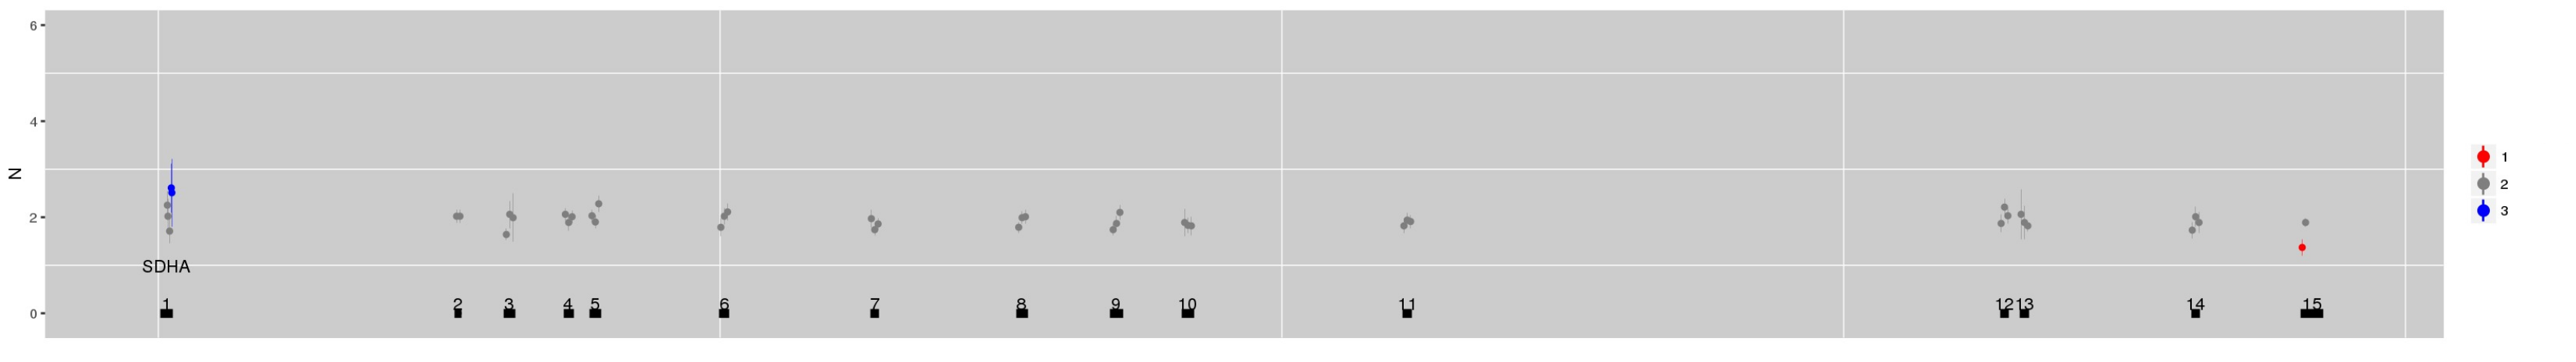
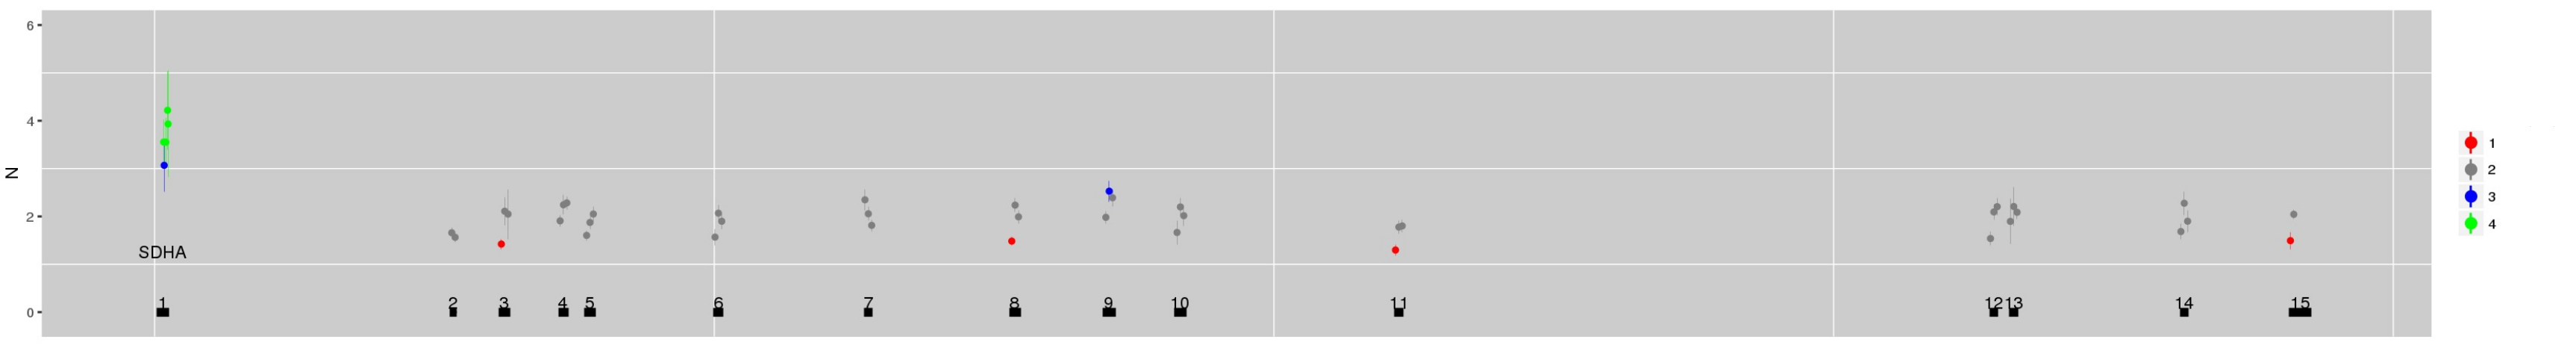
SI Figure 3 (b) Using multi-sample mode it is possible to use negative control samples from different sequencing batches to explore evolution of technical artefacts. (a) The CN estimate for the gene SDHA for NA12878 derived using references from germline samples of a similar vintage. (b) Estimates derived instead from the same sample sequenced 14 months later.
Interactive version of SI Figure 3
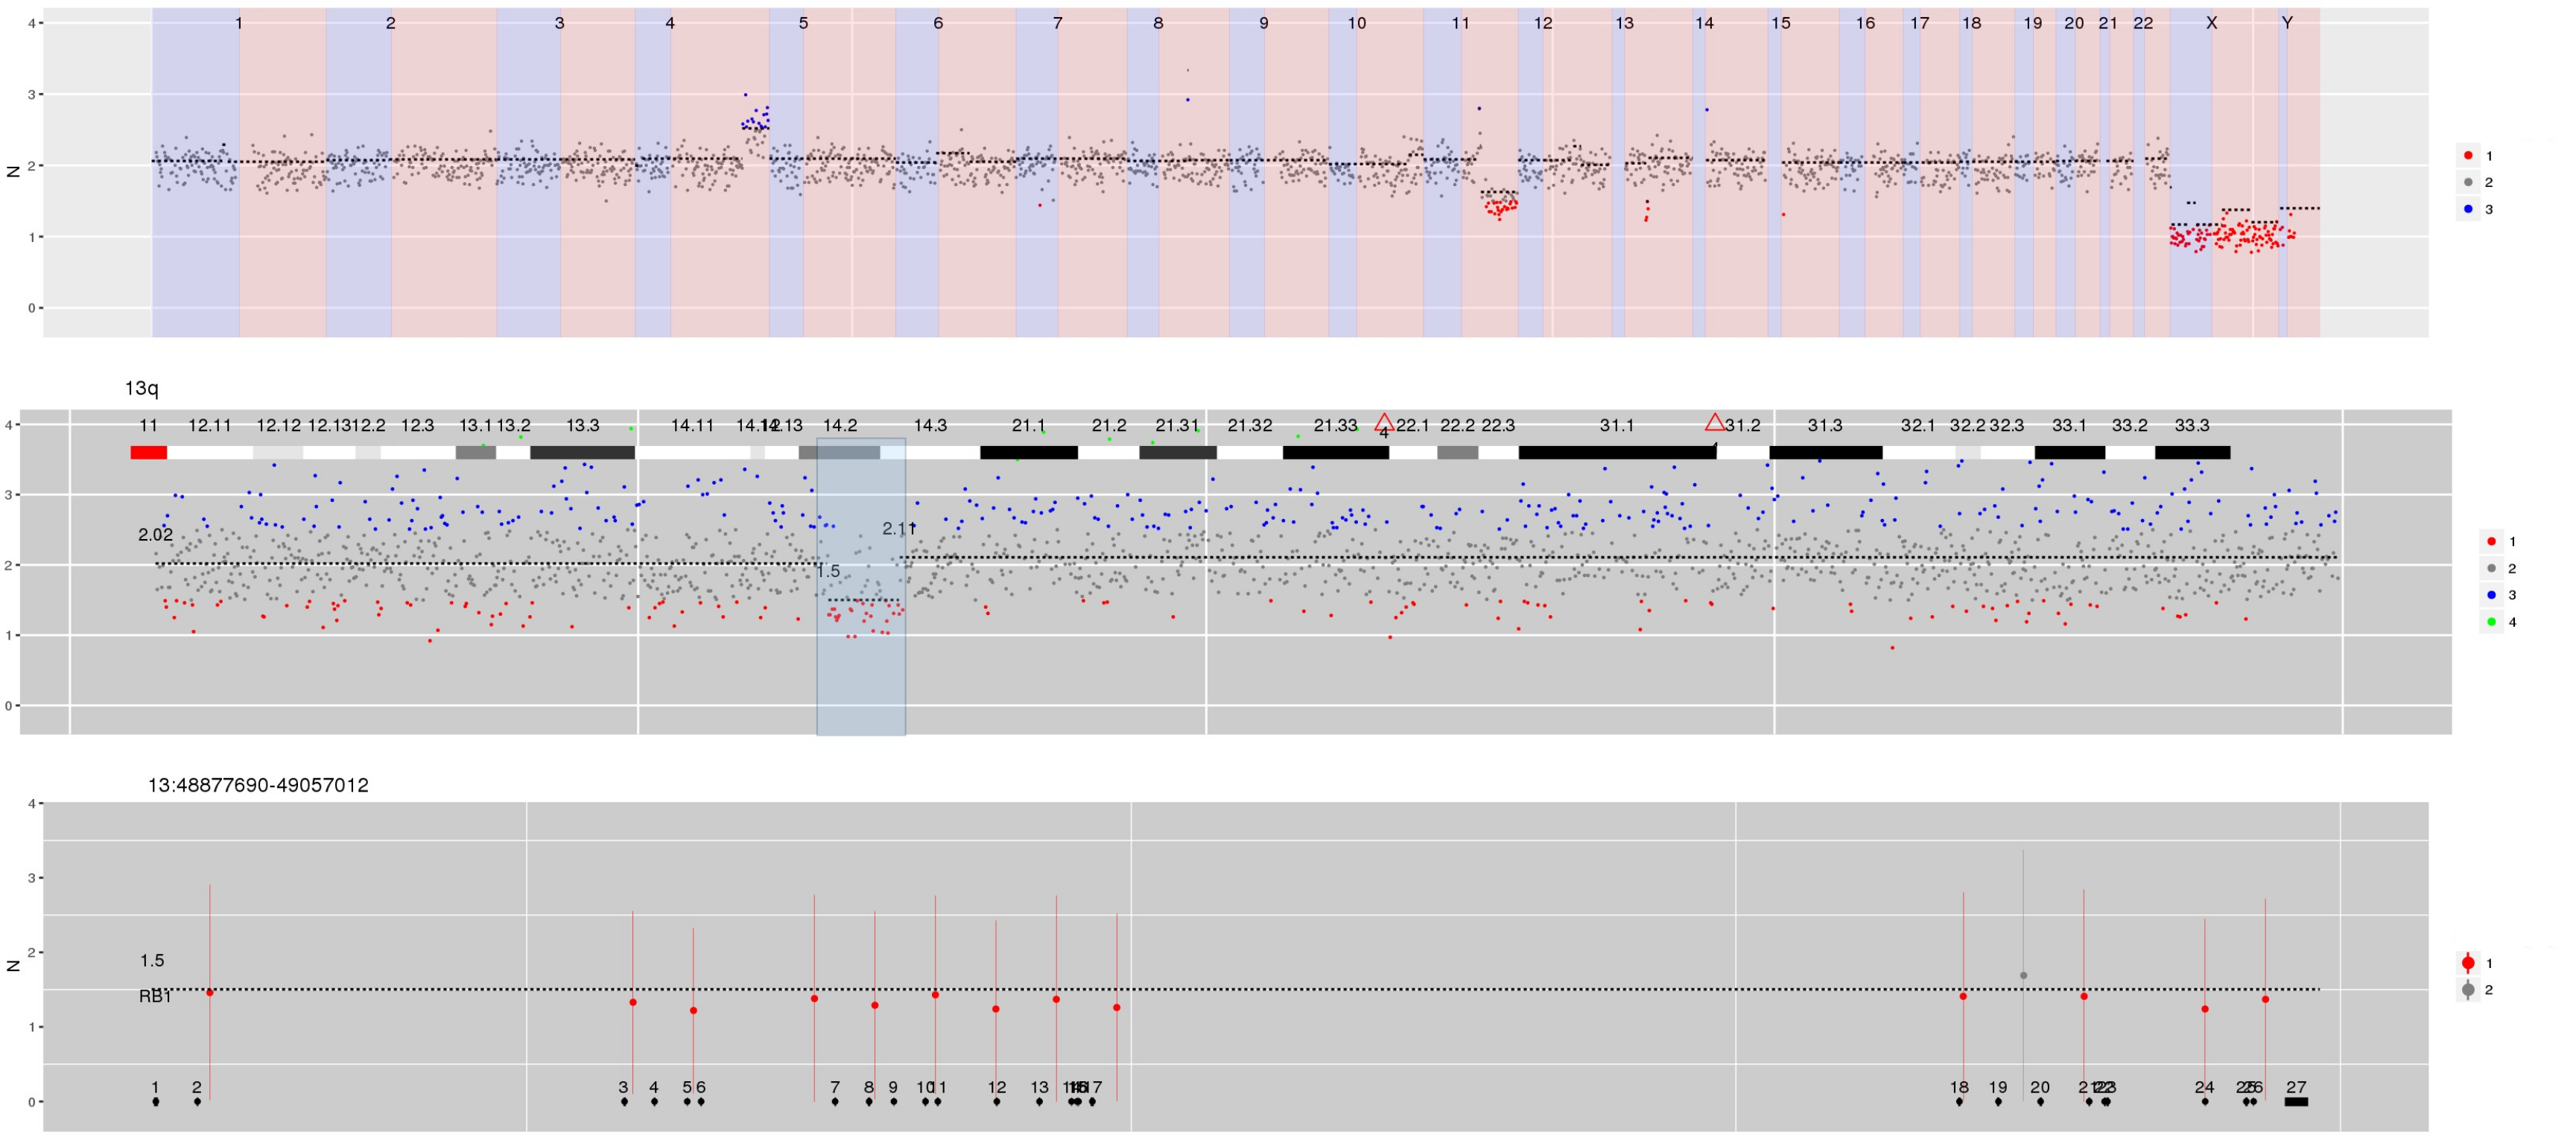
SI Figure 4 CN estimates for WG derived from targeted sequencing of a germline sample from a patient being screened for mutations that confer an increased risk of cancer. Inspection of the sample shows contamination which is consistent with chronic lymphocytic leukaemia - for example the highlighted deletion of RB1 as well as the deletion in 11q containing ATM.
Interactive version of SI Figure 4
SI Figure 5 CN estimates for WG derived from targeted sequencing is plotted using an auxilliary track in conjunction with BAFs and segmented differential expression obtained from RNA-seq. Averaging over differential transcript abundance across segments shows concordance with CN derived from DNA-seq while BAFs derived from RNA-seq give indications of homzygosity and clonality.
Interactive version of SI Figure 5
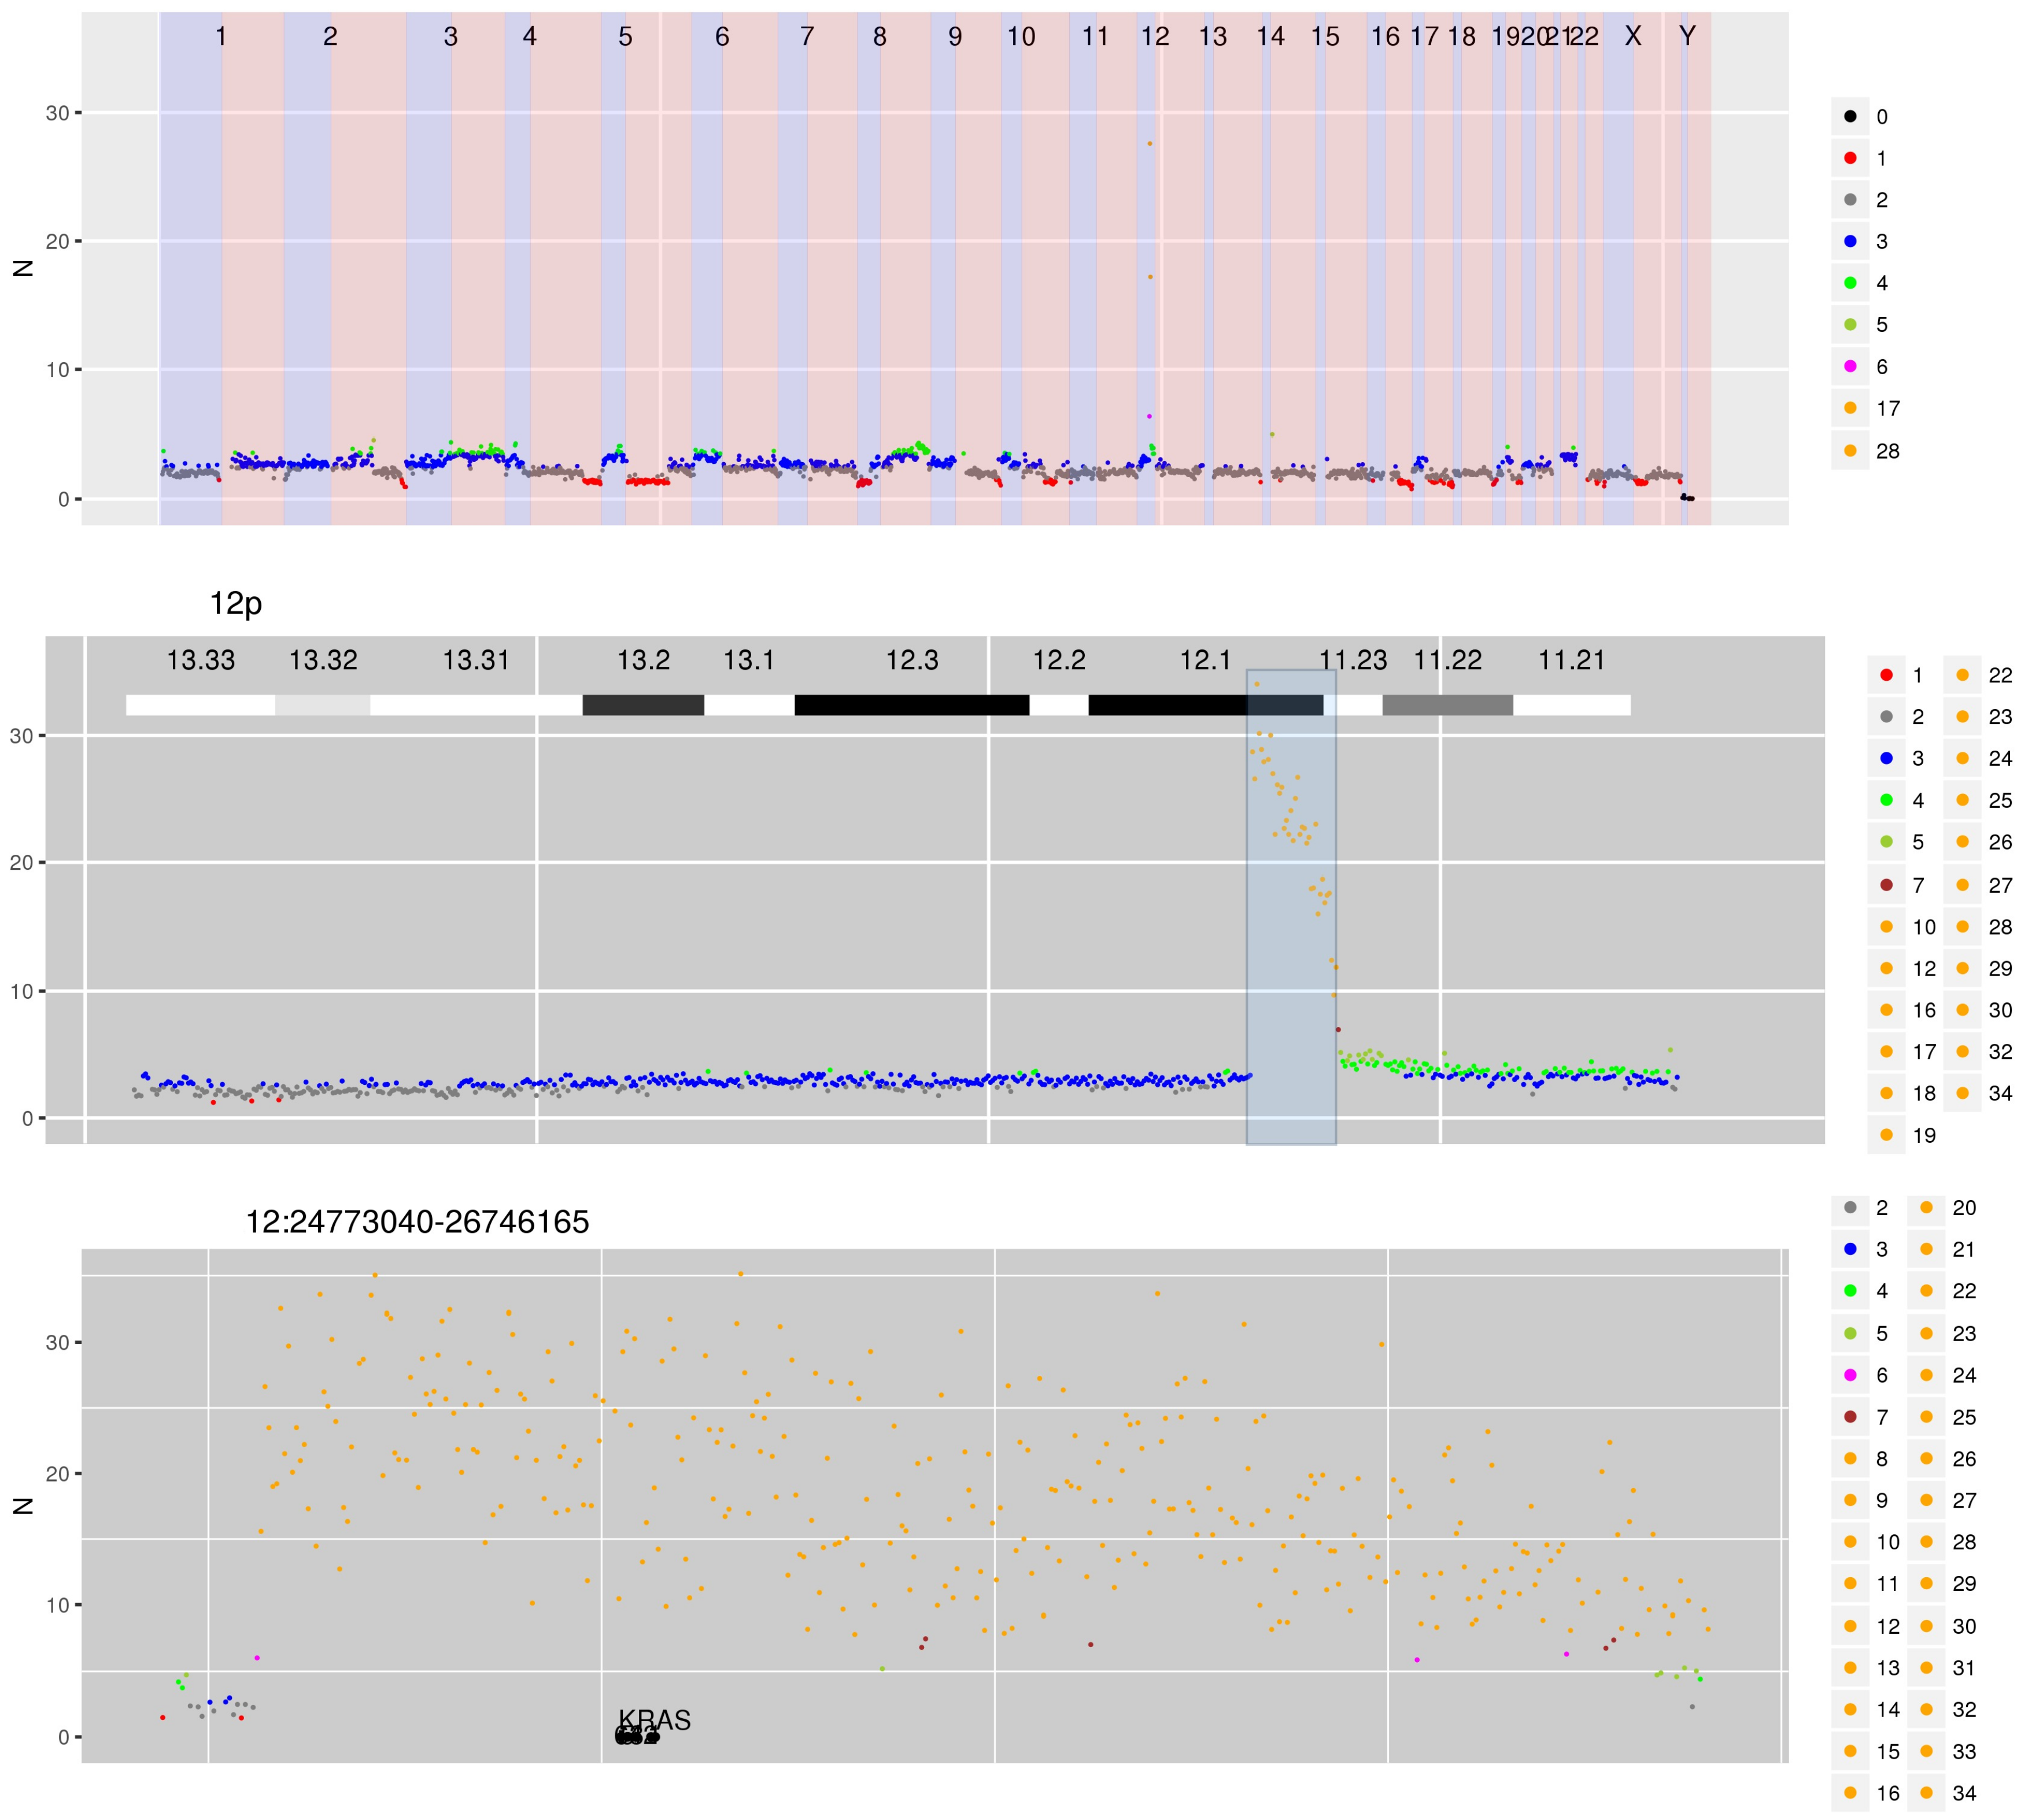
SI Figure 6 CN estimates for WG derived from targeted sequencing of high grade ovarian cancer. The scale has been adjusted to enable visualisation of a focal amplification of KRAS to 10-30 copies.
Interactive version of SI Figure 6
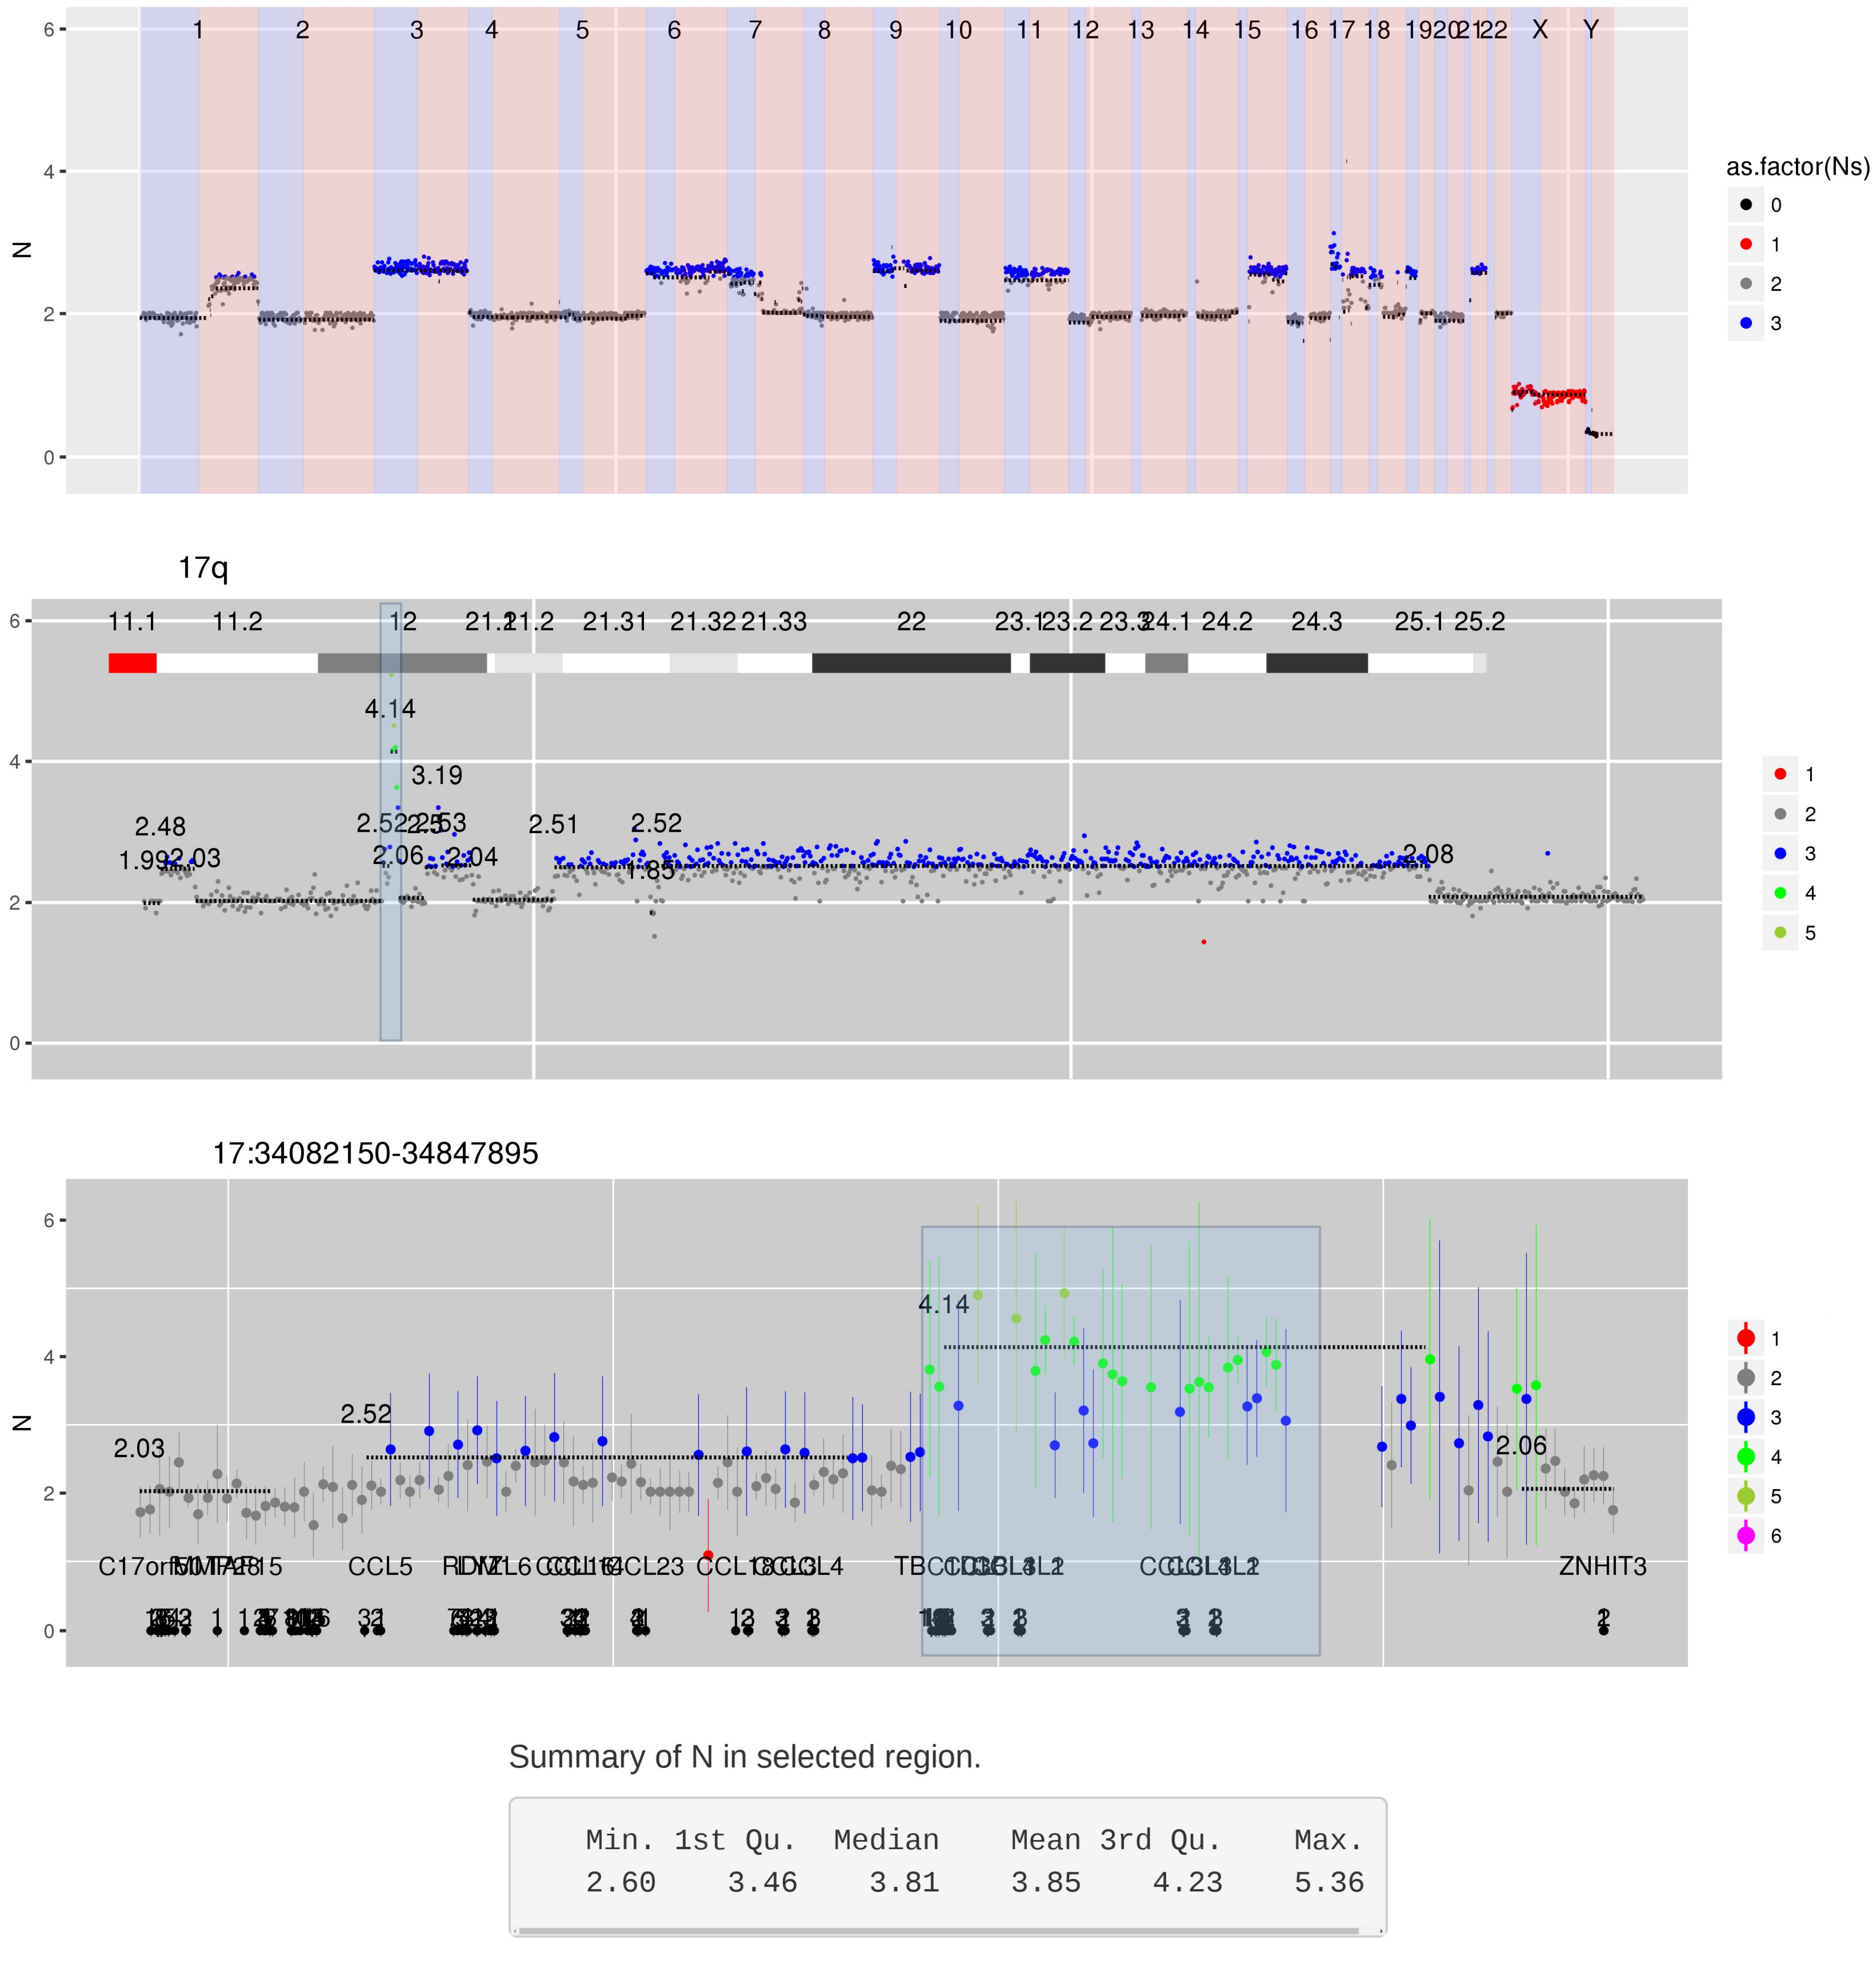
SI Figure 7 CN estimates for WG derived from LC-WGS sequencing of a myeloma sample. A focal amplification of a range of chemokine genes is highlighted on chromosome 17q.
Interactive version of SI Figure 7
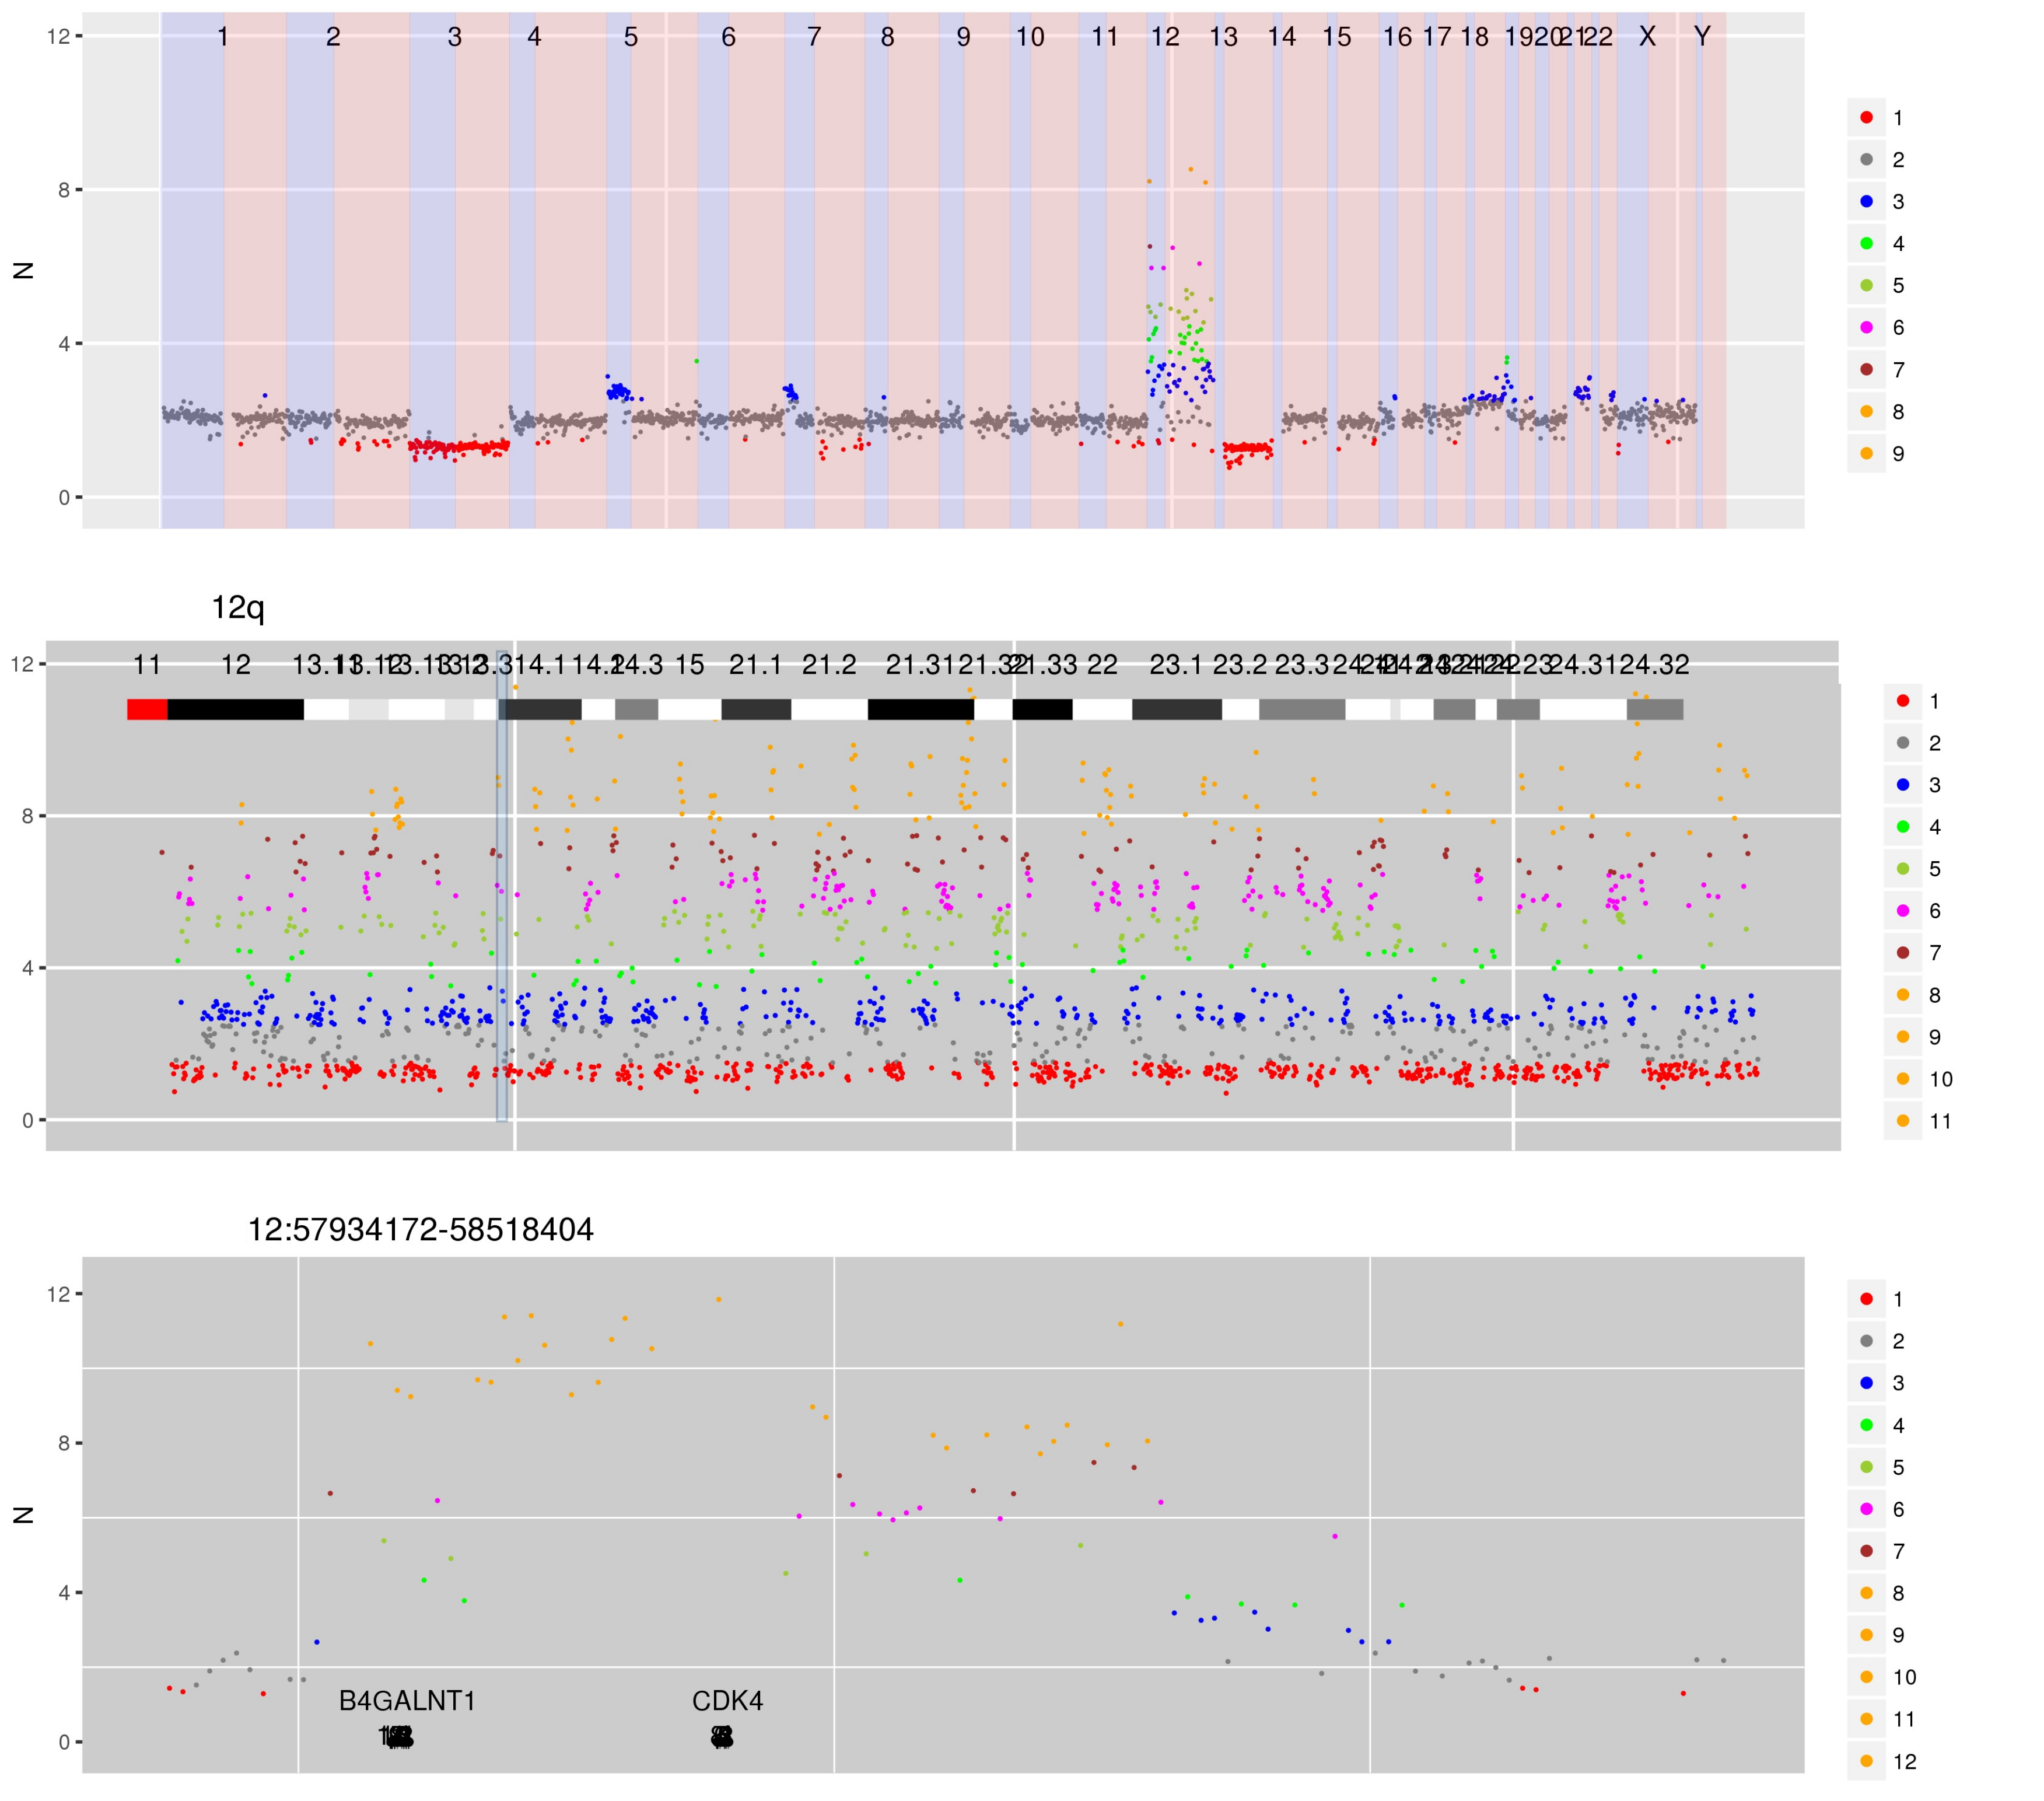
SI Figure 8 CN estimates for WG derived from targeted sequencing of a likely de-differentiated liposarcoma. A complex genomic re-arrangement on chromosome 12 has caused segments of amplification at CN 3, 5 and beyond. Highly amplified regions on chromosome 12 include 12p13.31-13.2 (CCND2, ~14 copies), 12q14.1 (CDK4, ~13 copies), 12q15 (MDM2, ~10 copies), 12q24.22 (TBX3, ~11 copies).
Interactive version of SI Figure 8
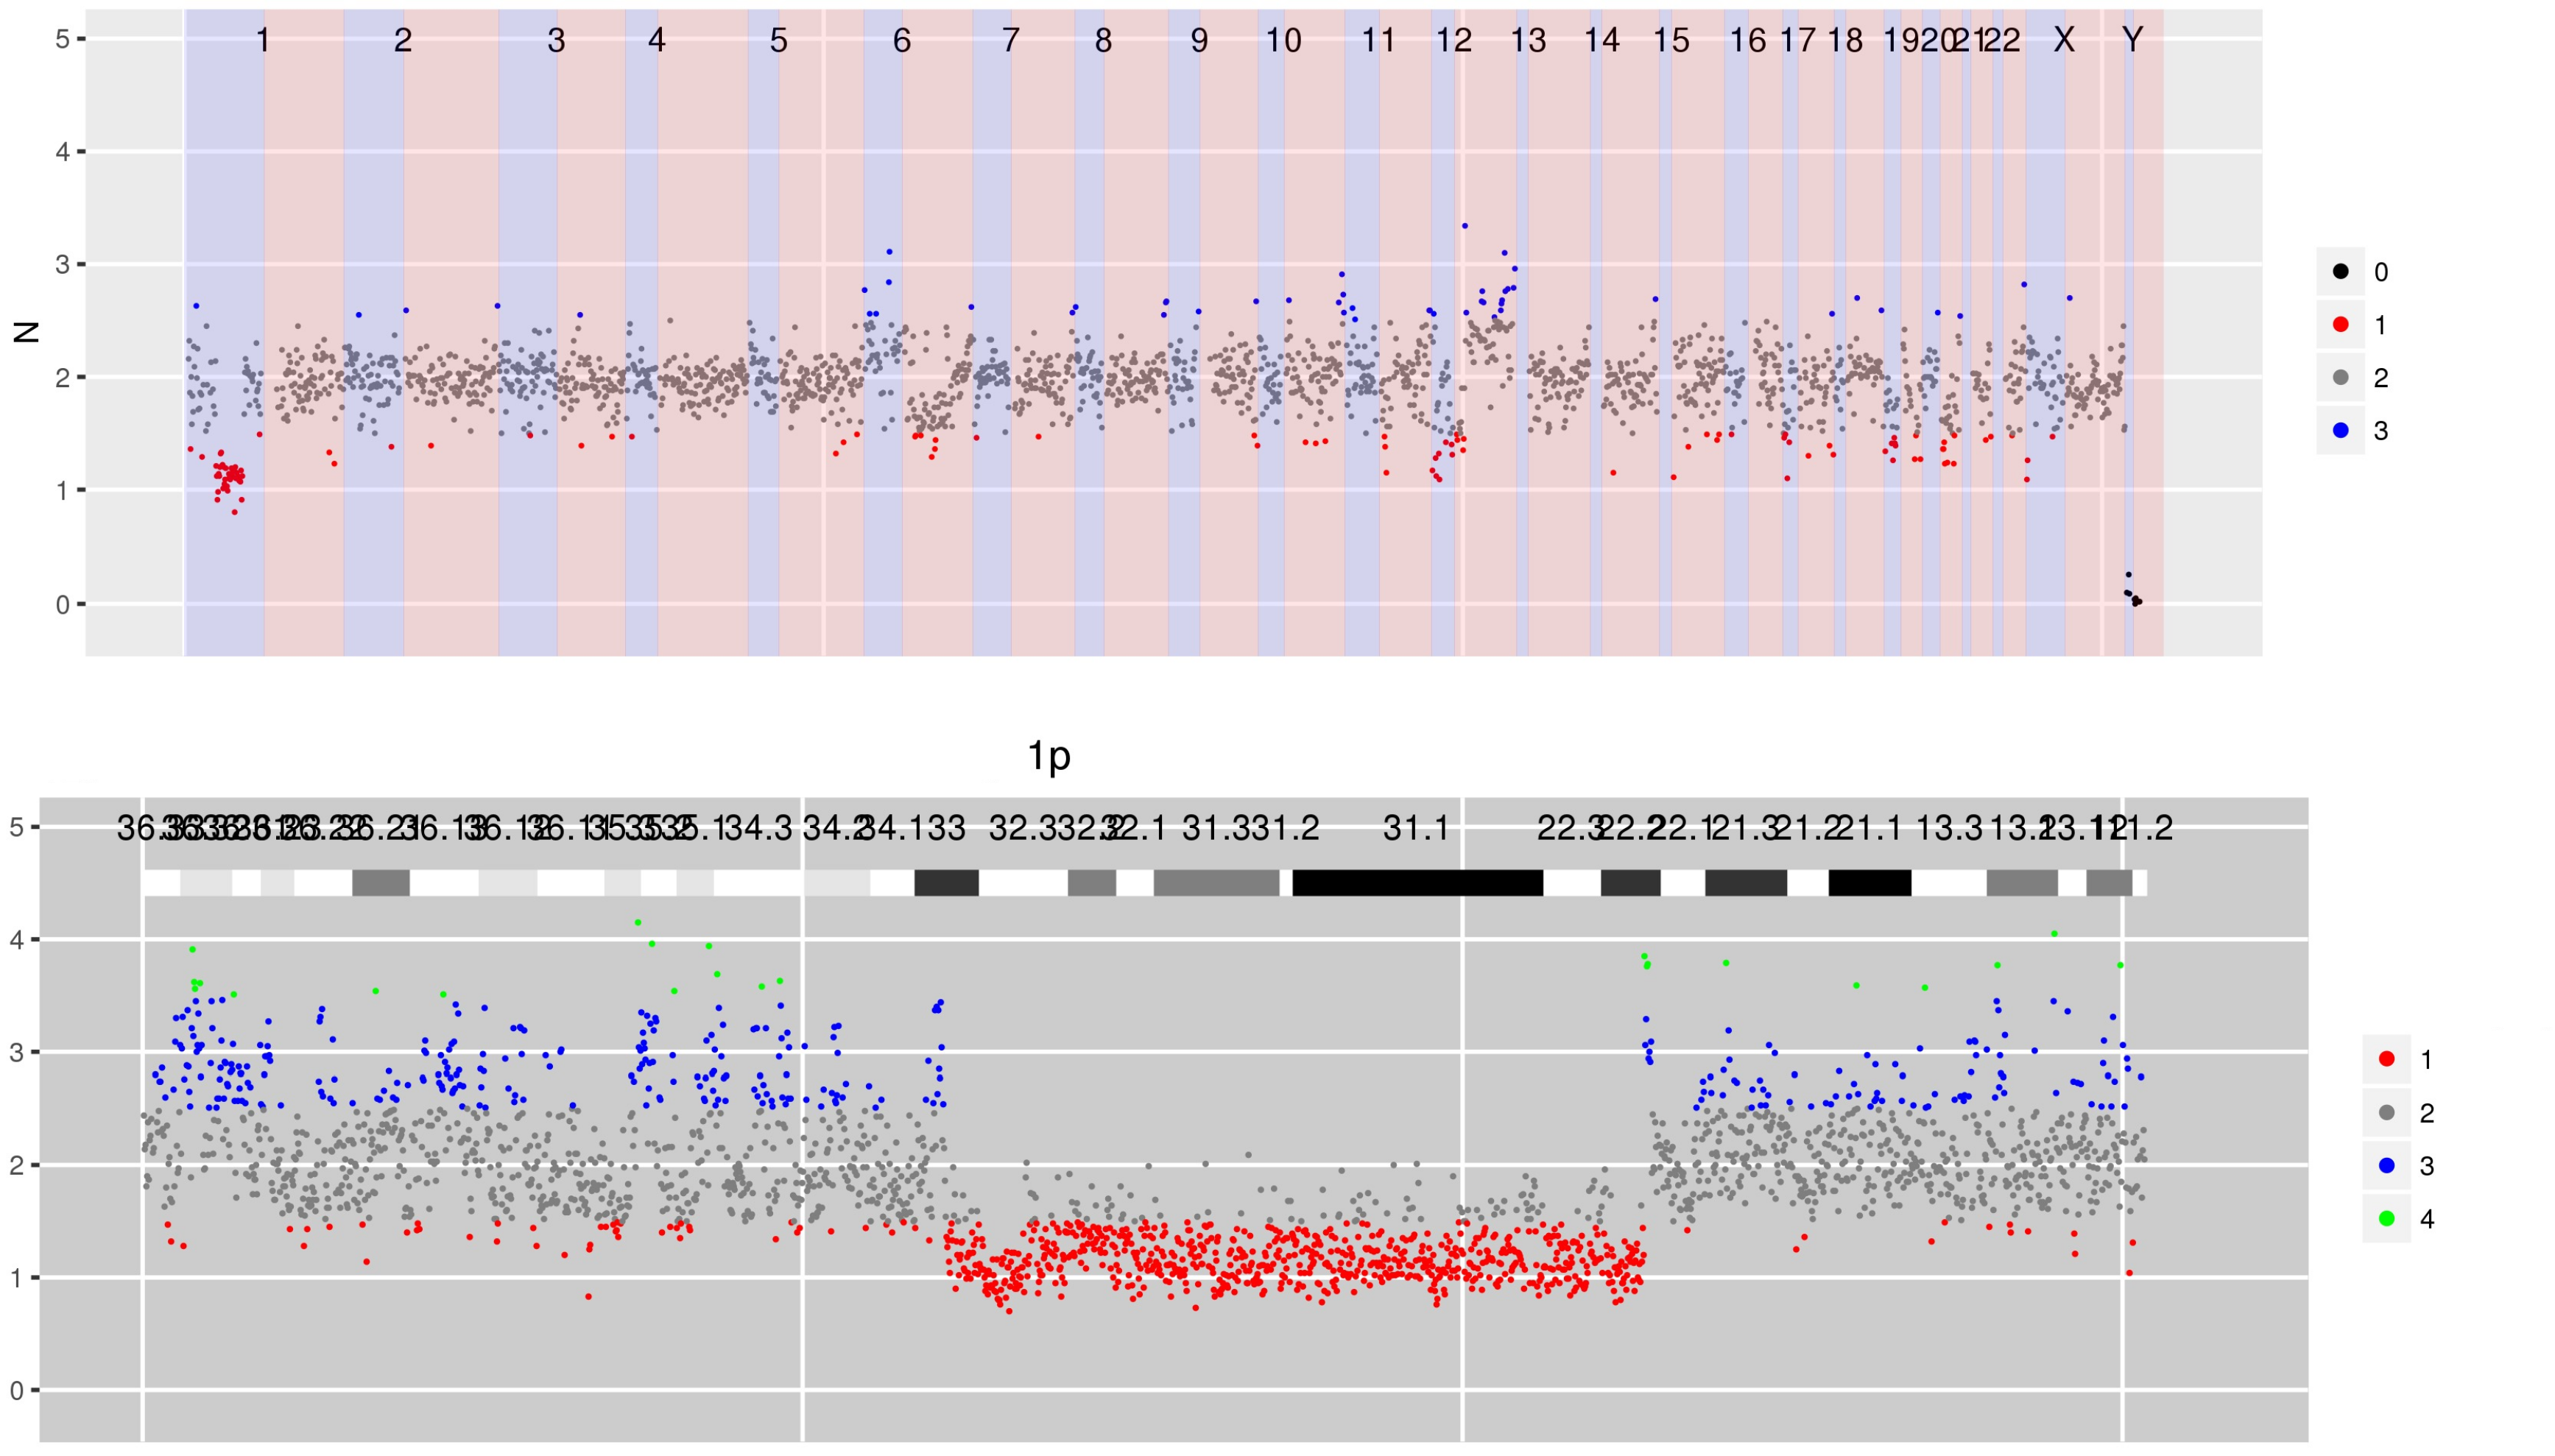
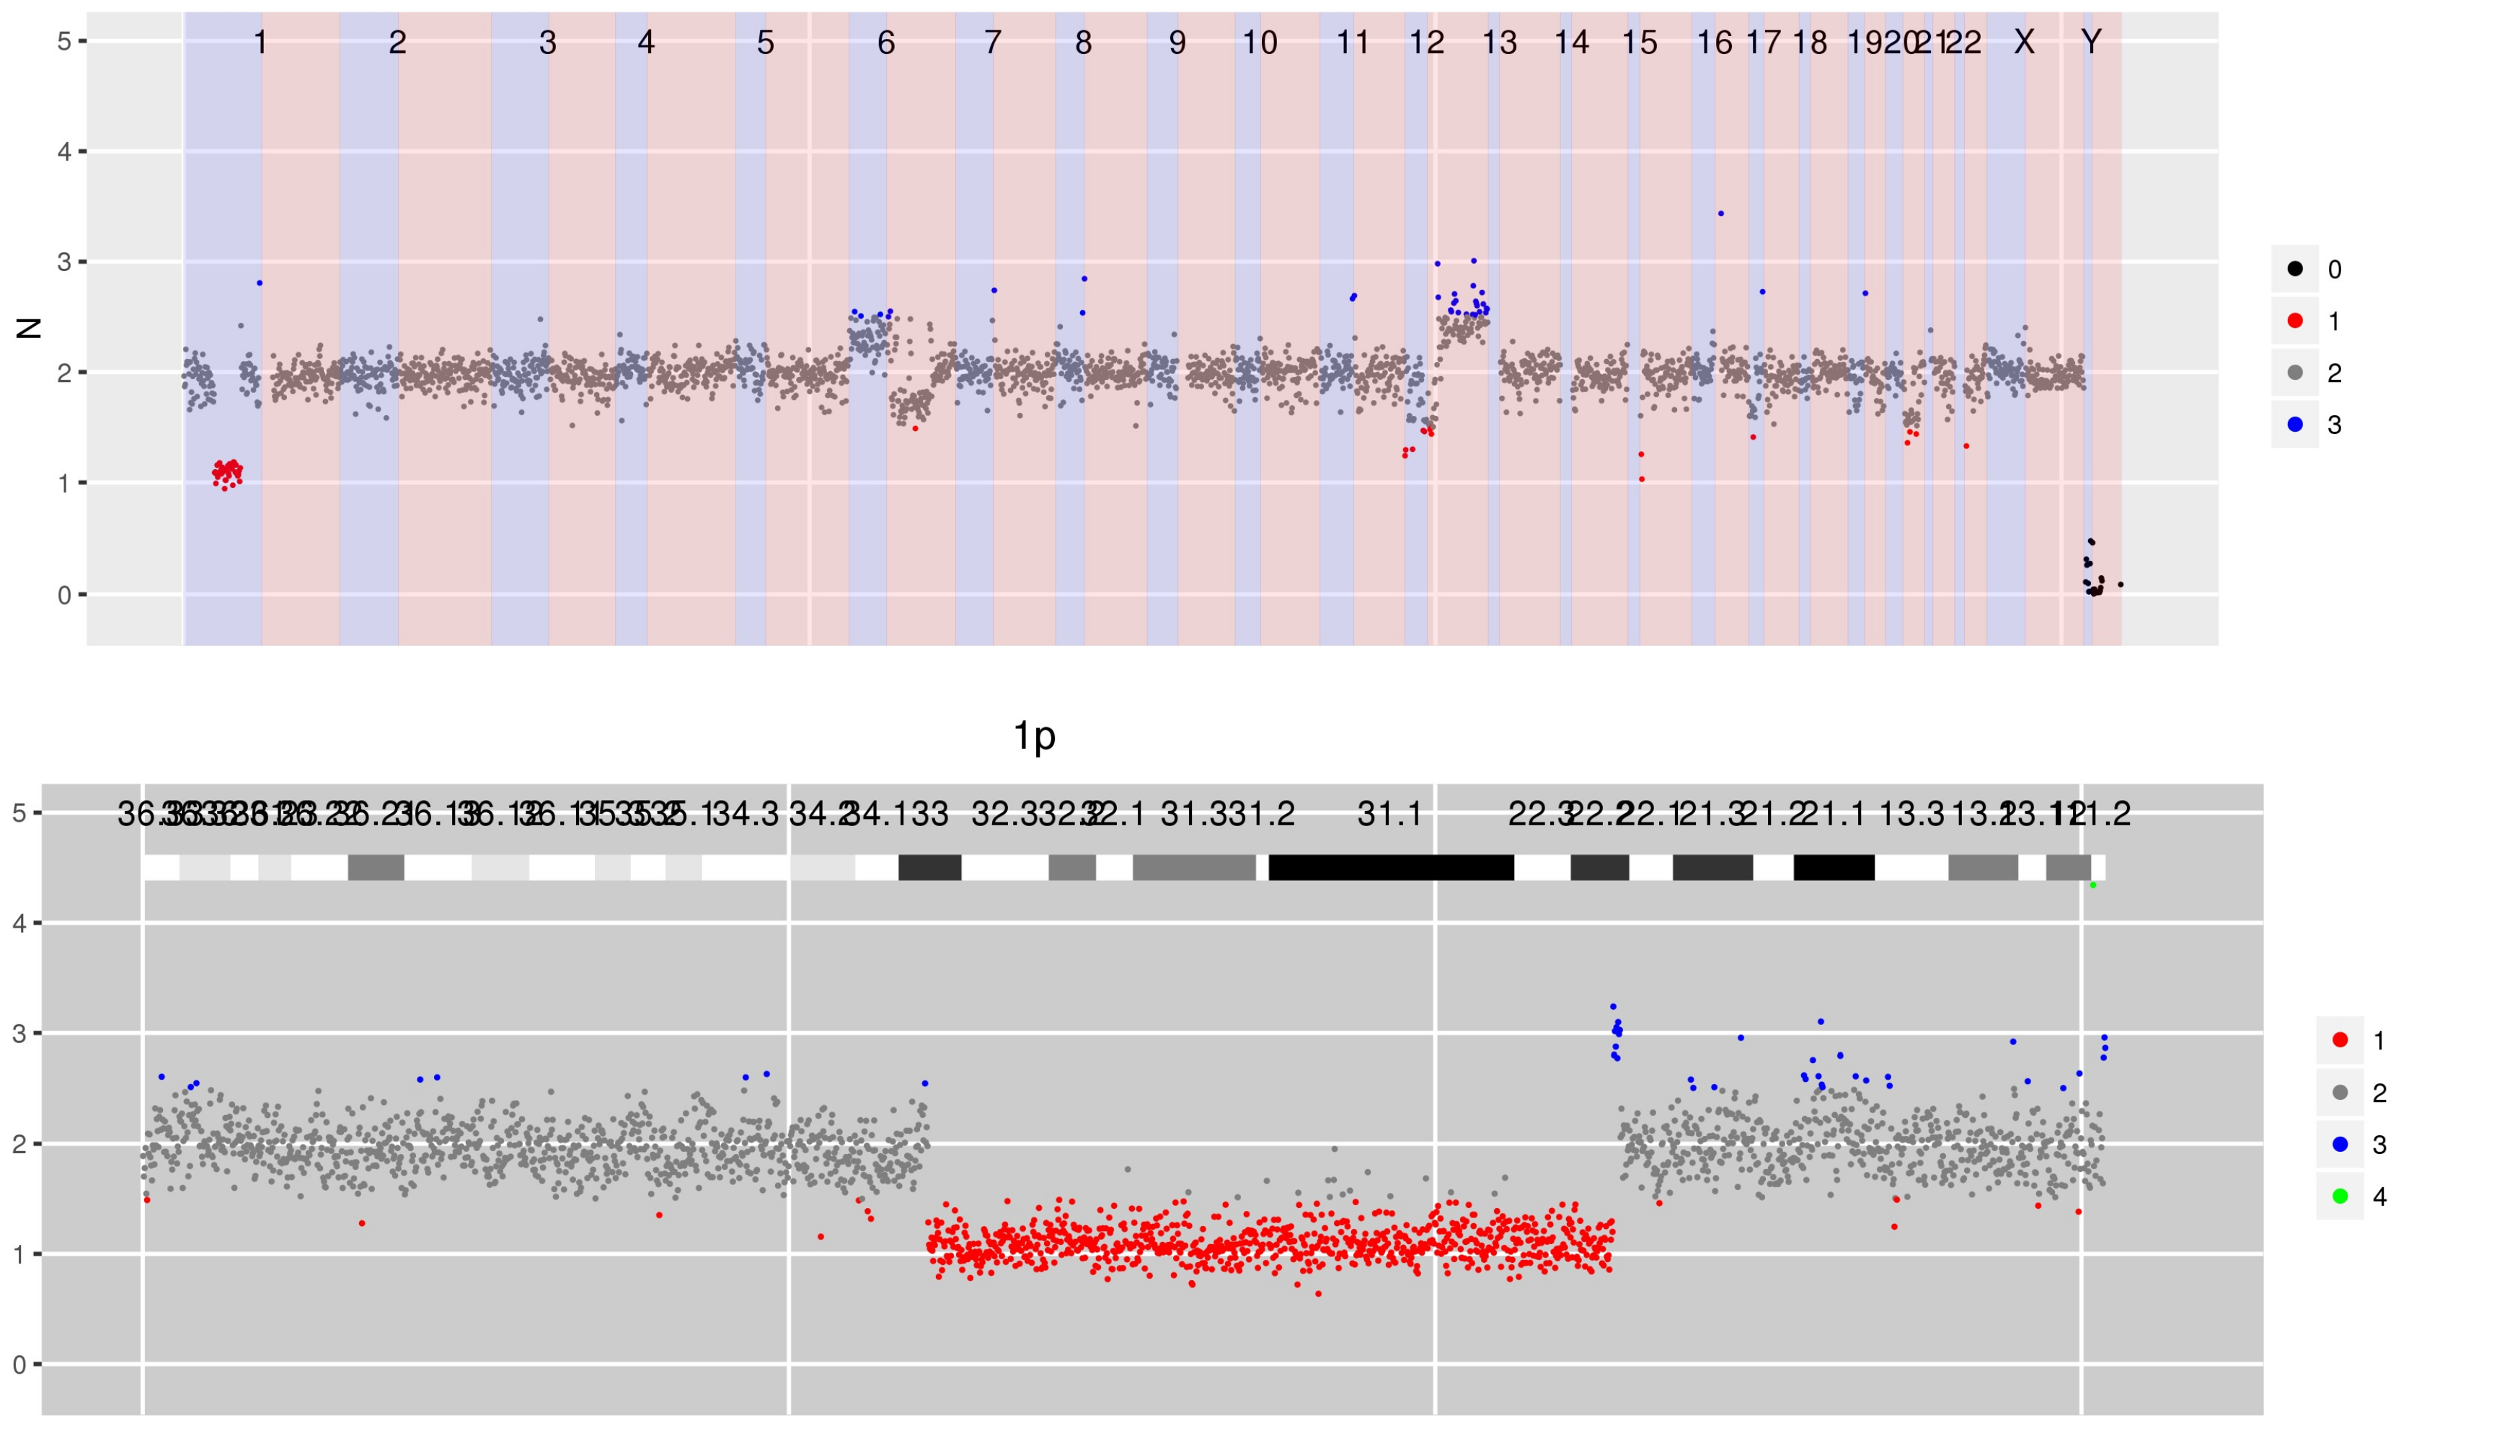
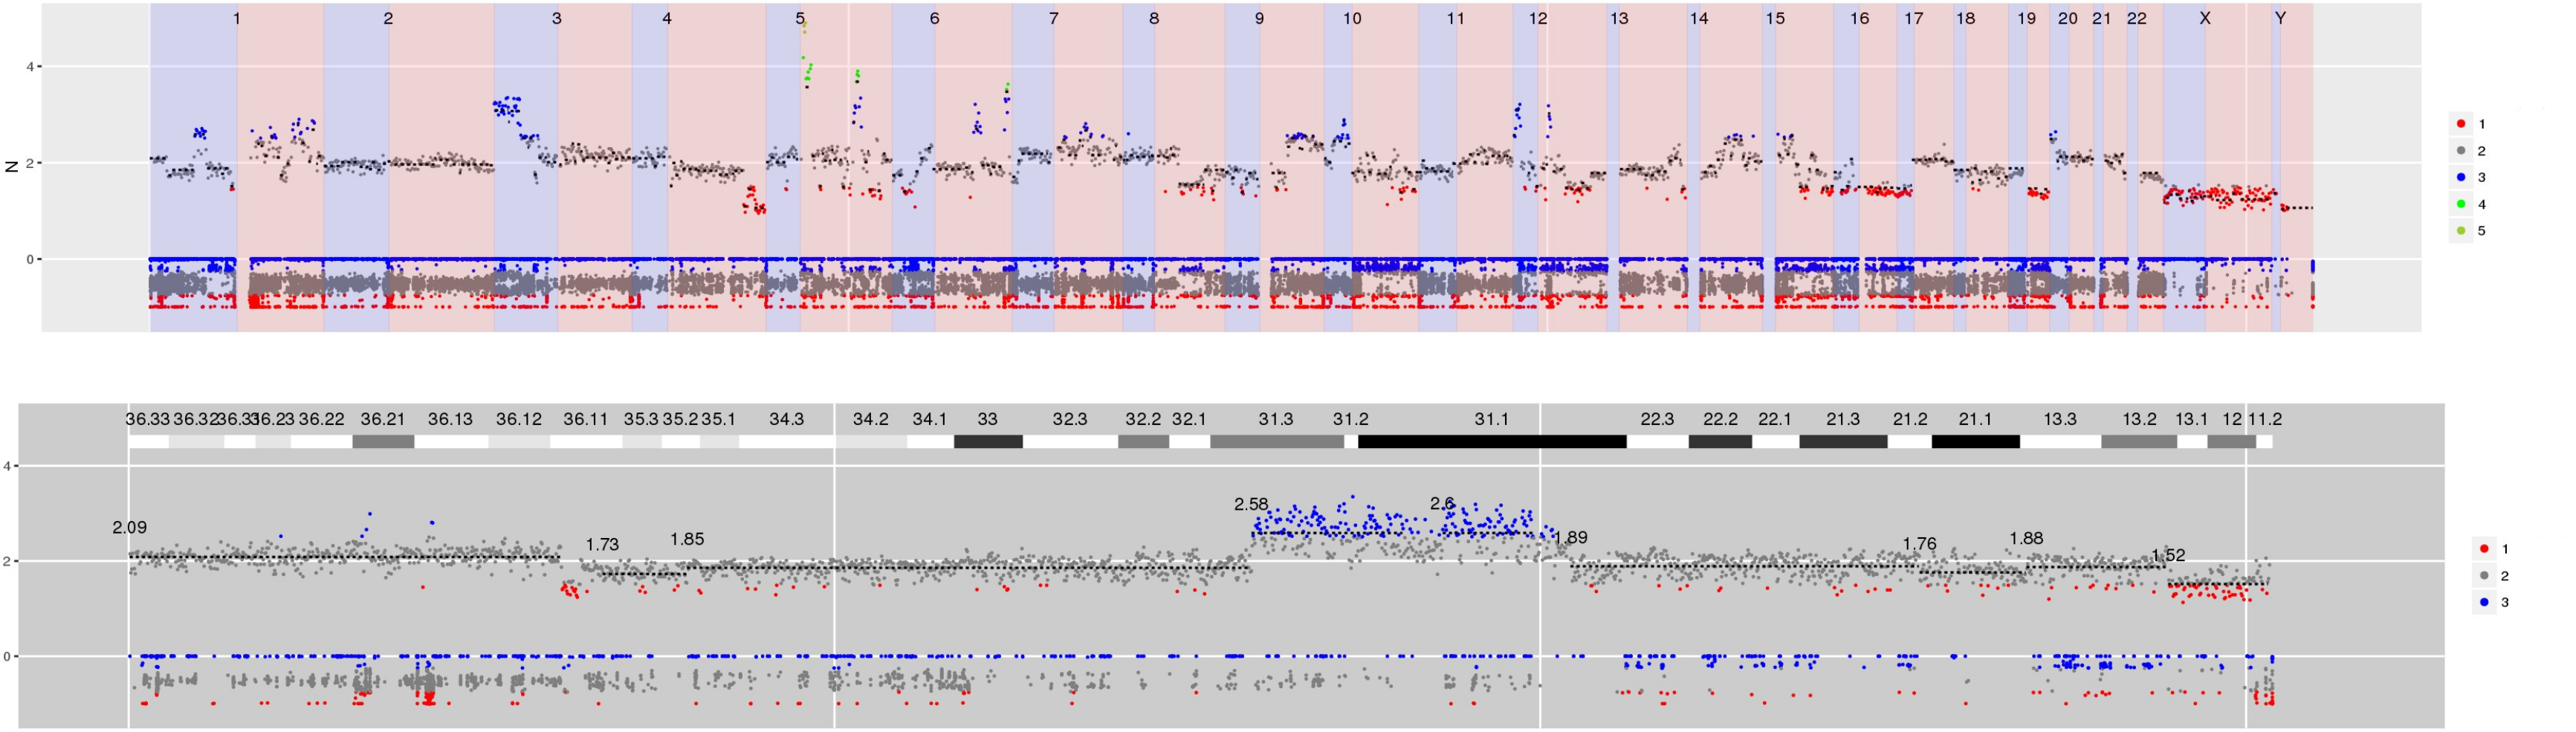
SI Figure 9 CN estimates for WG derived from targeted sequencing using the Agilent V5 exome kit. Copy number neutral loss off heterozygosity is apparent in parts of 1p, 10q and 12q.
Interactive version of SI Figure 9
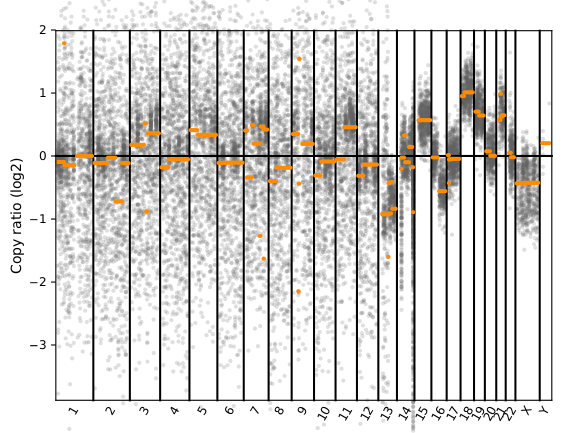
SI Figure 10 (a)
SI Figure 10 (b)
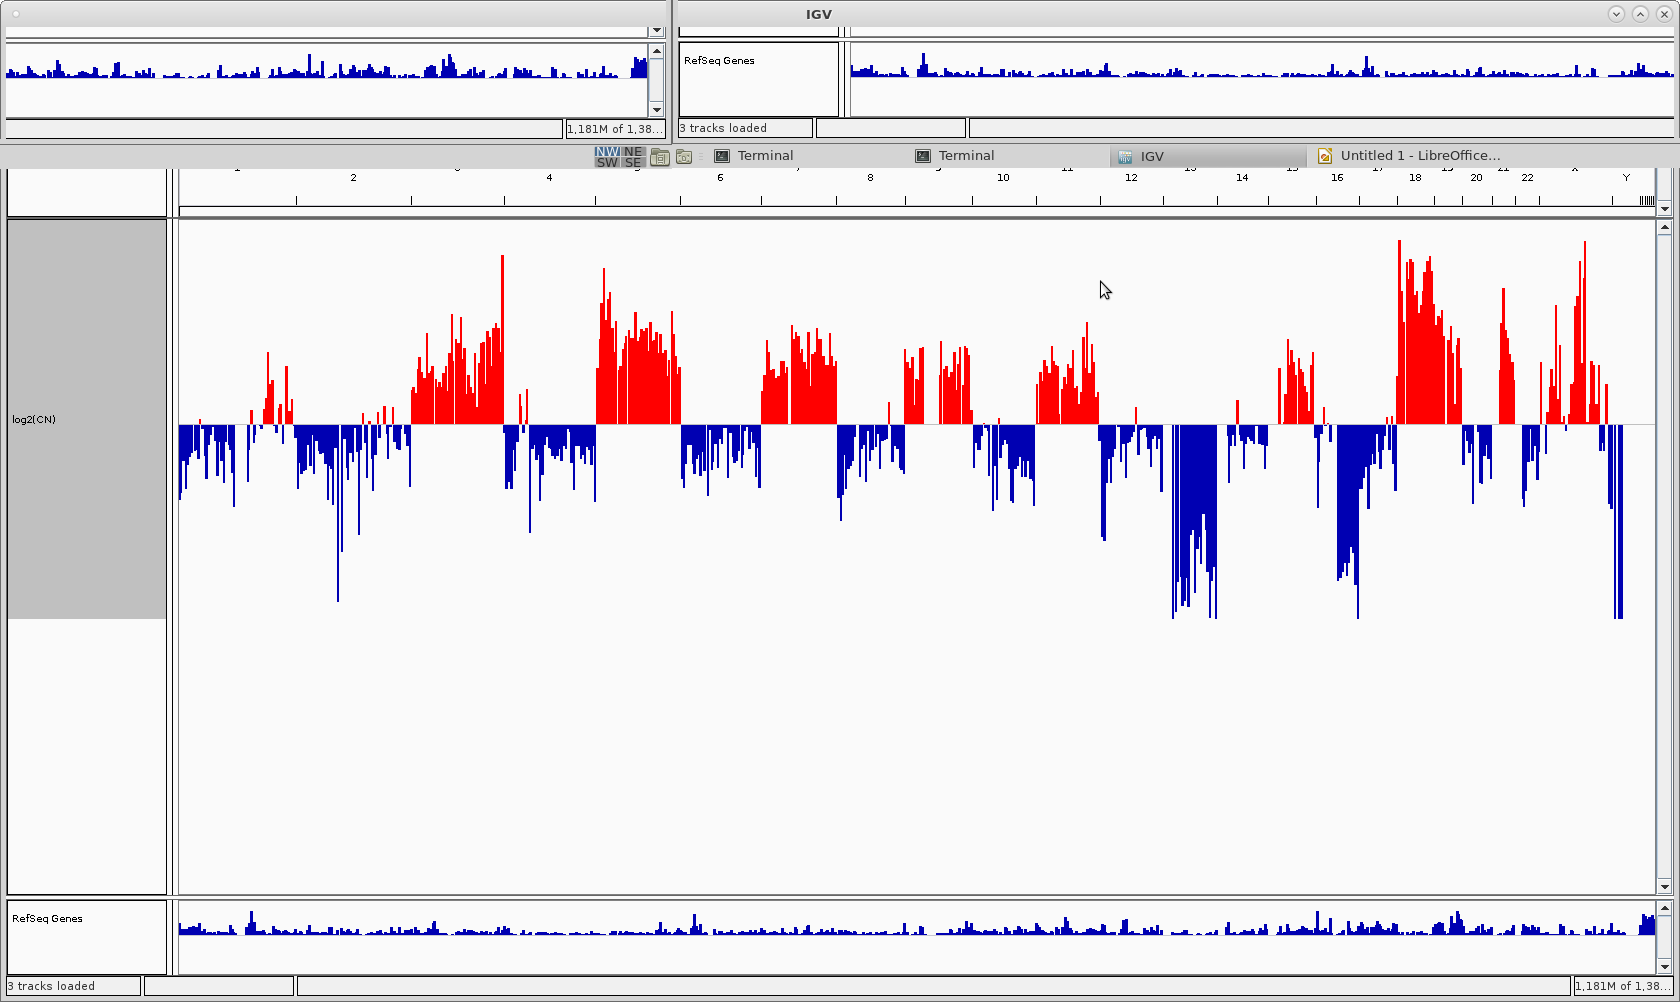
SI Figure 10 (c) Comparison of default data visualisation offered by (a) CNspector (b) cnvkit and (c) CopywriteR's IgV output track displayed at whole-genome resolution. The final output from canvas is a VCF containing segments at the WG level. While they do display in IgV, they do not render correctly and so we do not include the output.
SI Figure 11 (a)
SI Figure 11 (b) CNspector can display outputs derived from canvas, cnvkit and CopywriteR, potentially combining the best features from each. In this example, CN calls on exons come from canvas, CN calls on WG areas from CopyeriteR and binned B-allele frequencies and segmented CN after purity correction from CNVkit. (b) Using multi-sample mode enables further improvements to the CN estimates from CopywriteR since the dynamically generated reference contributes less noise to the final CN value than does the single representative sample used by CopywriteR to make the original calls.
Interactive version of SI Figure 11
SI Video 1 Annotated screen captures demonstrating how to use CNspector to navigate to CNVs shown in Figures 3-5 of the main text.
SI Video(ext) 1 Extended version of previous video including figures from SI.
Note: Some firewalls/proxy servers block Rshiny protocols in a way that the browser app cannot automatically detect and circumvent. If these links break then this is likely the problem. This can be fixed by pressing Ctrl+Alt+Shift+A (from a Mac: control+option+shift+A) and removing the blocked protocols as described here